It´s R-script to improve aesthetic plotting of princals function of Gifi package
g.princals is a function designed to address aesthetic issues encountered when using plot.princals of "Gifi" package(1), which exclusively generates plots using a "graphic" package. g.princals leverages the power of the ggplot2 package, renowned for producing high-quality visuals.this function just produce, transplot, scree plot, loadplot and biplot for hierarchical categoric variables(2).
"g.princals" replaces the default "plot" function in R, generating customized graphics for customer items.
- x: call a object was generated by princals(dataset).
- plot.dim: Vector with dimensions to be plotted with the default condition being set to c(1, 2).
- var.subset: with the default condition being set to"all"
- max.plot.array: with the default condition being set to 2.
- stepvec: Vector whether step function should be plotted (see details in princals/R Documentation).with the default condition being set to NA.
- col.lines: colour of line. Default condition being set to "black".
- main: Title of picture. Default condition being set to name of princals object.
- show: Options to choose are TRUE,FALSE,T,F,1 and 0. Default condition being set to "1" mean it shows plots.
- save: Options to choose are TRUE,FALSE,T,F,1 and 0. Default condition being set to "1" mean it saves plots.
- name: label or name of princals object. Default condition being set to name of princals object.
- units: unit of width/height in 'mm'
- width: Default condition being set to 250mm.
- height: Default condition being set to 250mm.
- res: resolution of pictures. Default condition being set to 300 pixels.
- dispersion: dispersion of scores of object in loadplot.it is decreased overdispersion or underdispersion. Default condition being set to 3, it means, mean±3*standard deviation.
- point.size.loadplot: it is point size of loadplot. Default condition being set to 1.
- point.alpha.loadplot: it is point alpha(transparency) of loadplot. Default condition being set to 0.1,
- language: choose a English or Spanish like language. Default condition being set English.
- legend.position: Options to choose are none, left, right, bottom, and top. Default condition being set to right. it means legend position is to right.
- legend.group: Options to choose are TRUE,FALSE,T,F,1 and 0. Default condition being set to "1" mean it shows legend.
Finally, it were showed a picture which generated by "g.princals". If the label names are lengthy, it's advisable to shorten them into acronyms.
################################################################################
setwd("~/file")
source("https://github.com/jasb3110/g.princals/blob/f286b26f79da57600c3e7f207a6f653f24028a76/g.princals.R)

library("Gifi")
# ordinal PCA
fitord <- princals(ABC,ndim = 2)## ordinal PCA
g.princals(fitord,save=0,show=1,dispersion =3,legend.group = 0)#show plots
g.princals(fitord,save=0,show=1,dispersion =3,colour.group = c(rep("A",5),rep("B",6)),legend.group = 1,language = "spanish")#show plots

g.princals(fitord,save=1,show=1,dispersion =3,legend.group = 0)#save plots in PNG format
g.princals(fitord,save=1,show=0,dispersion =3,colour.group = c(rep("A",5),rep("B",6)),legend.group = 1,language = "spanish")#save plots in PNG format
################################################################################In this section, an R script and corresponding plots created using the g.princals function are presented in Spanish, and group of variables.
 |
|---|
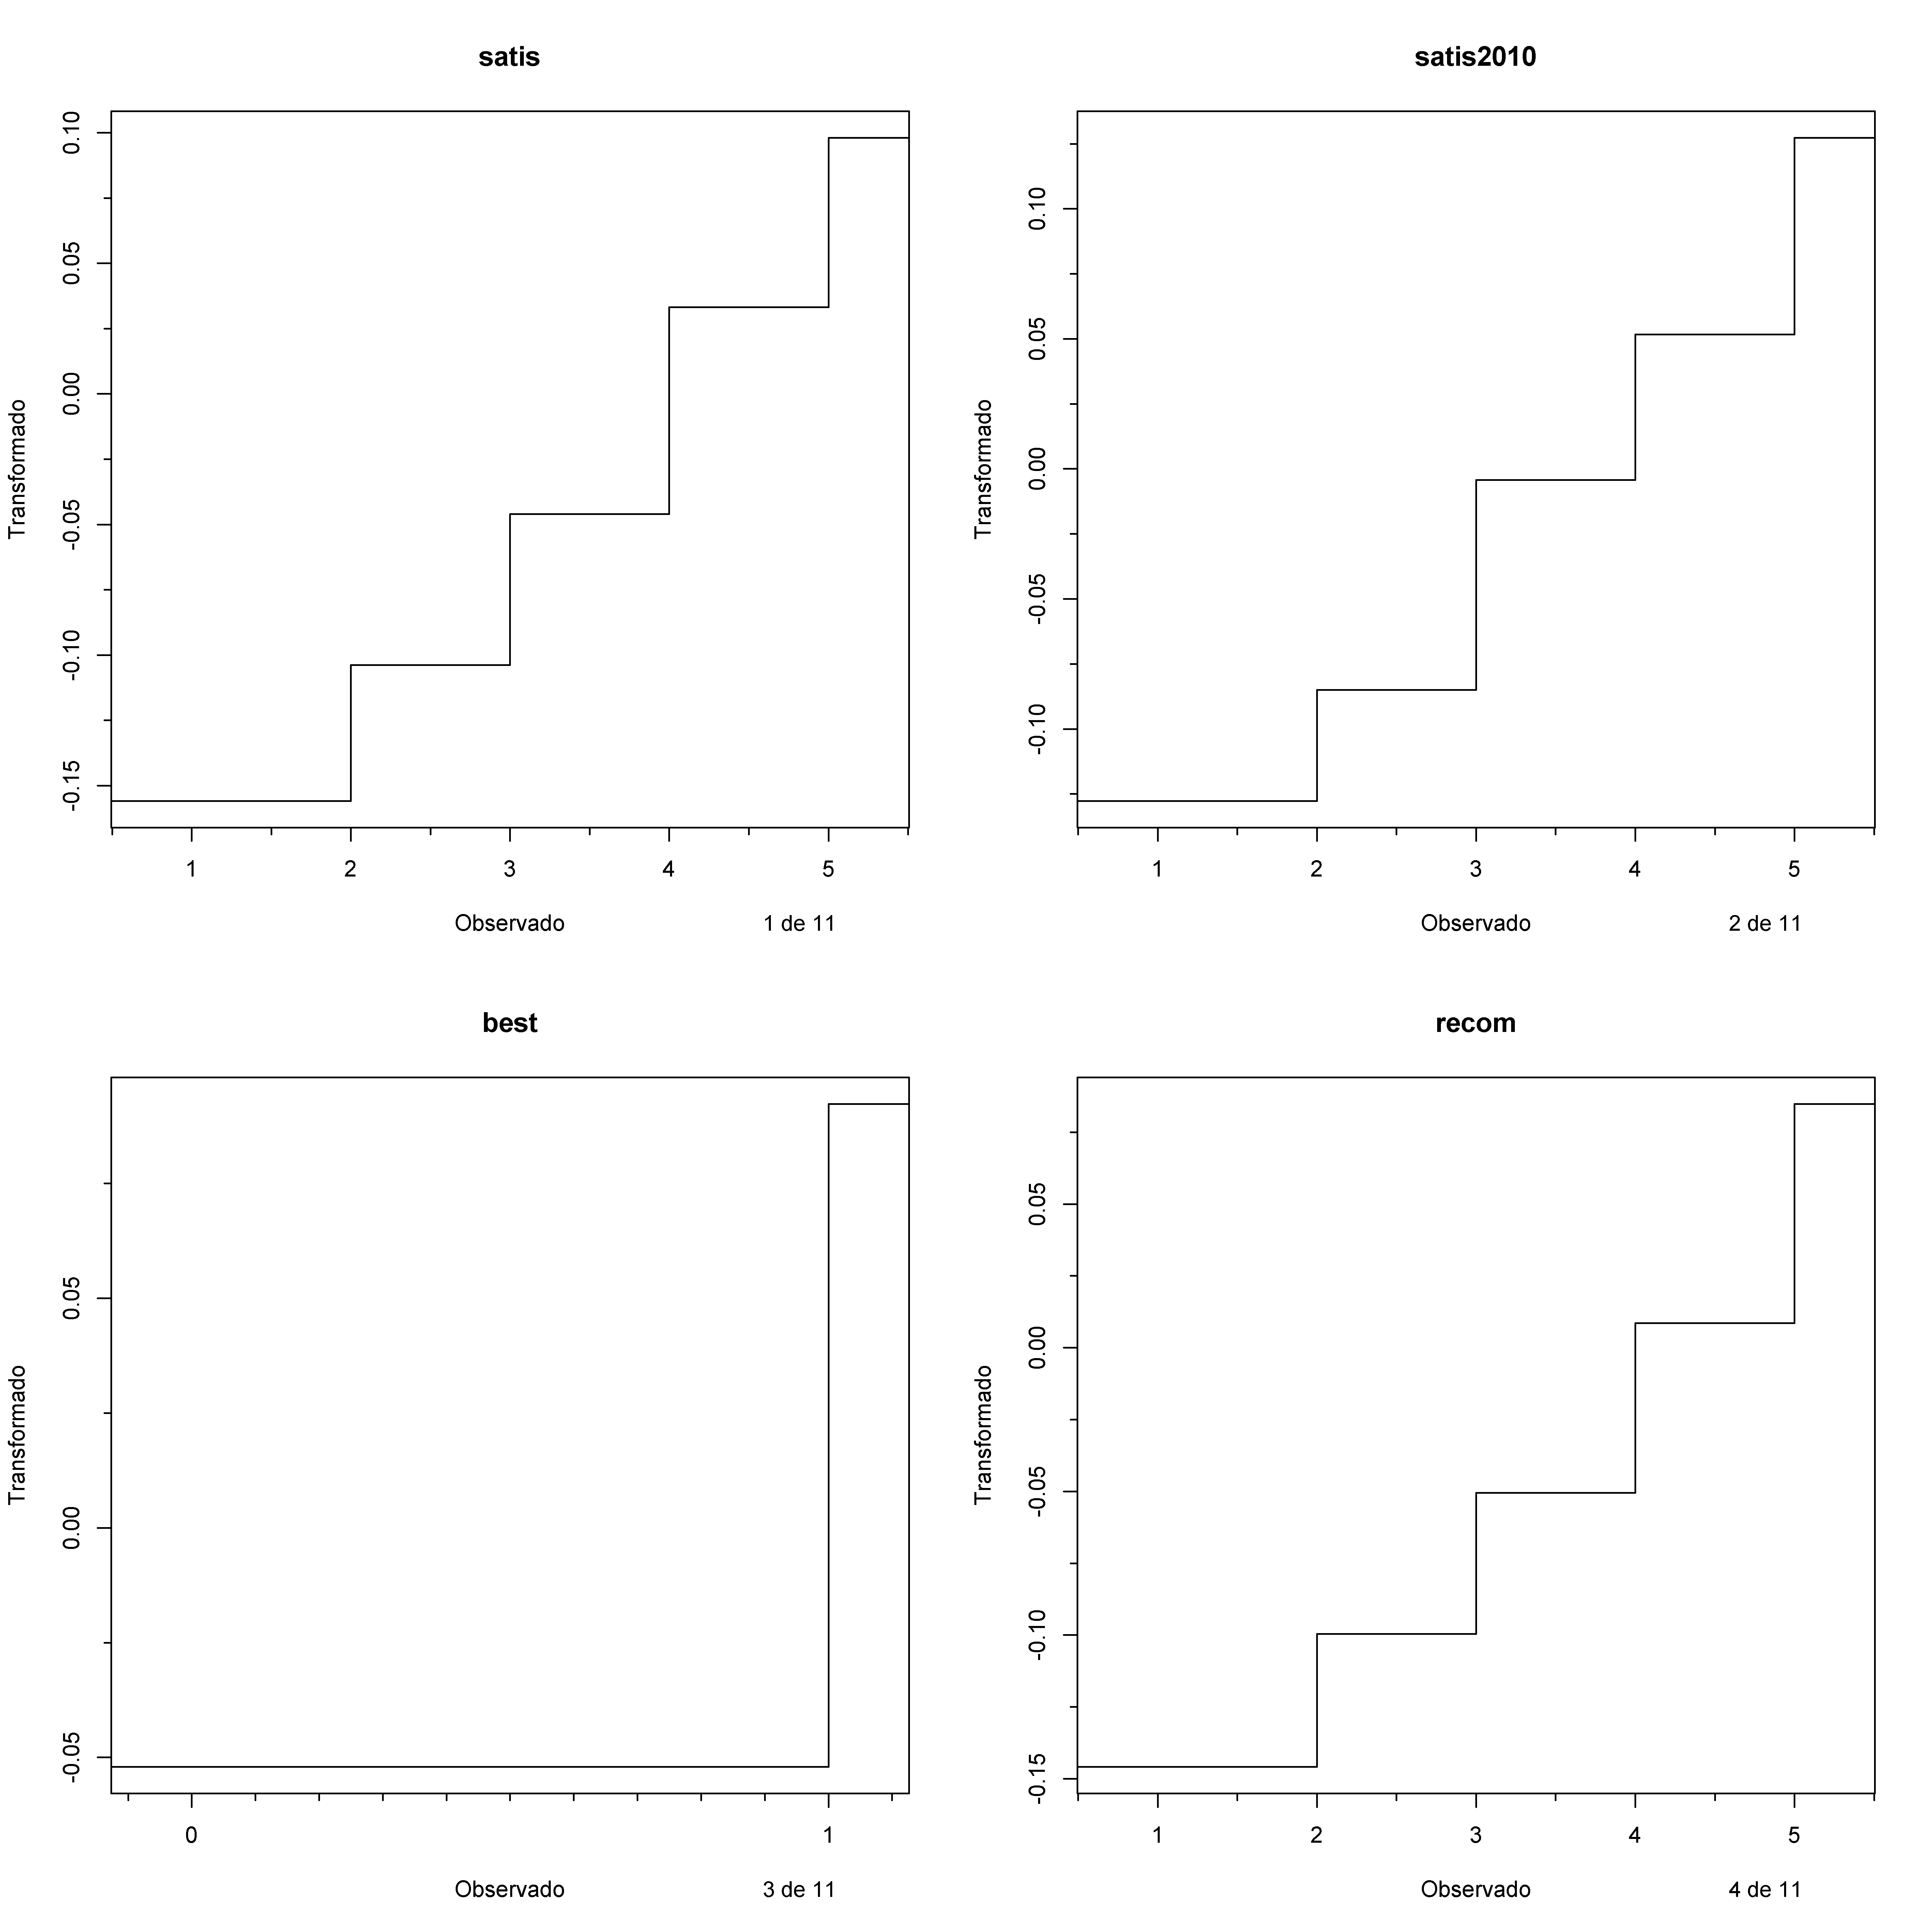
| Picture. Transplots of ABC dataset, just 1 to 4 variables |
 |
|---|
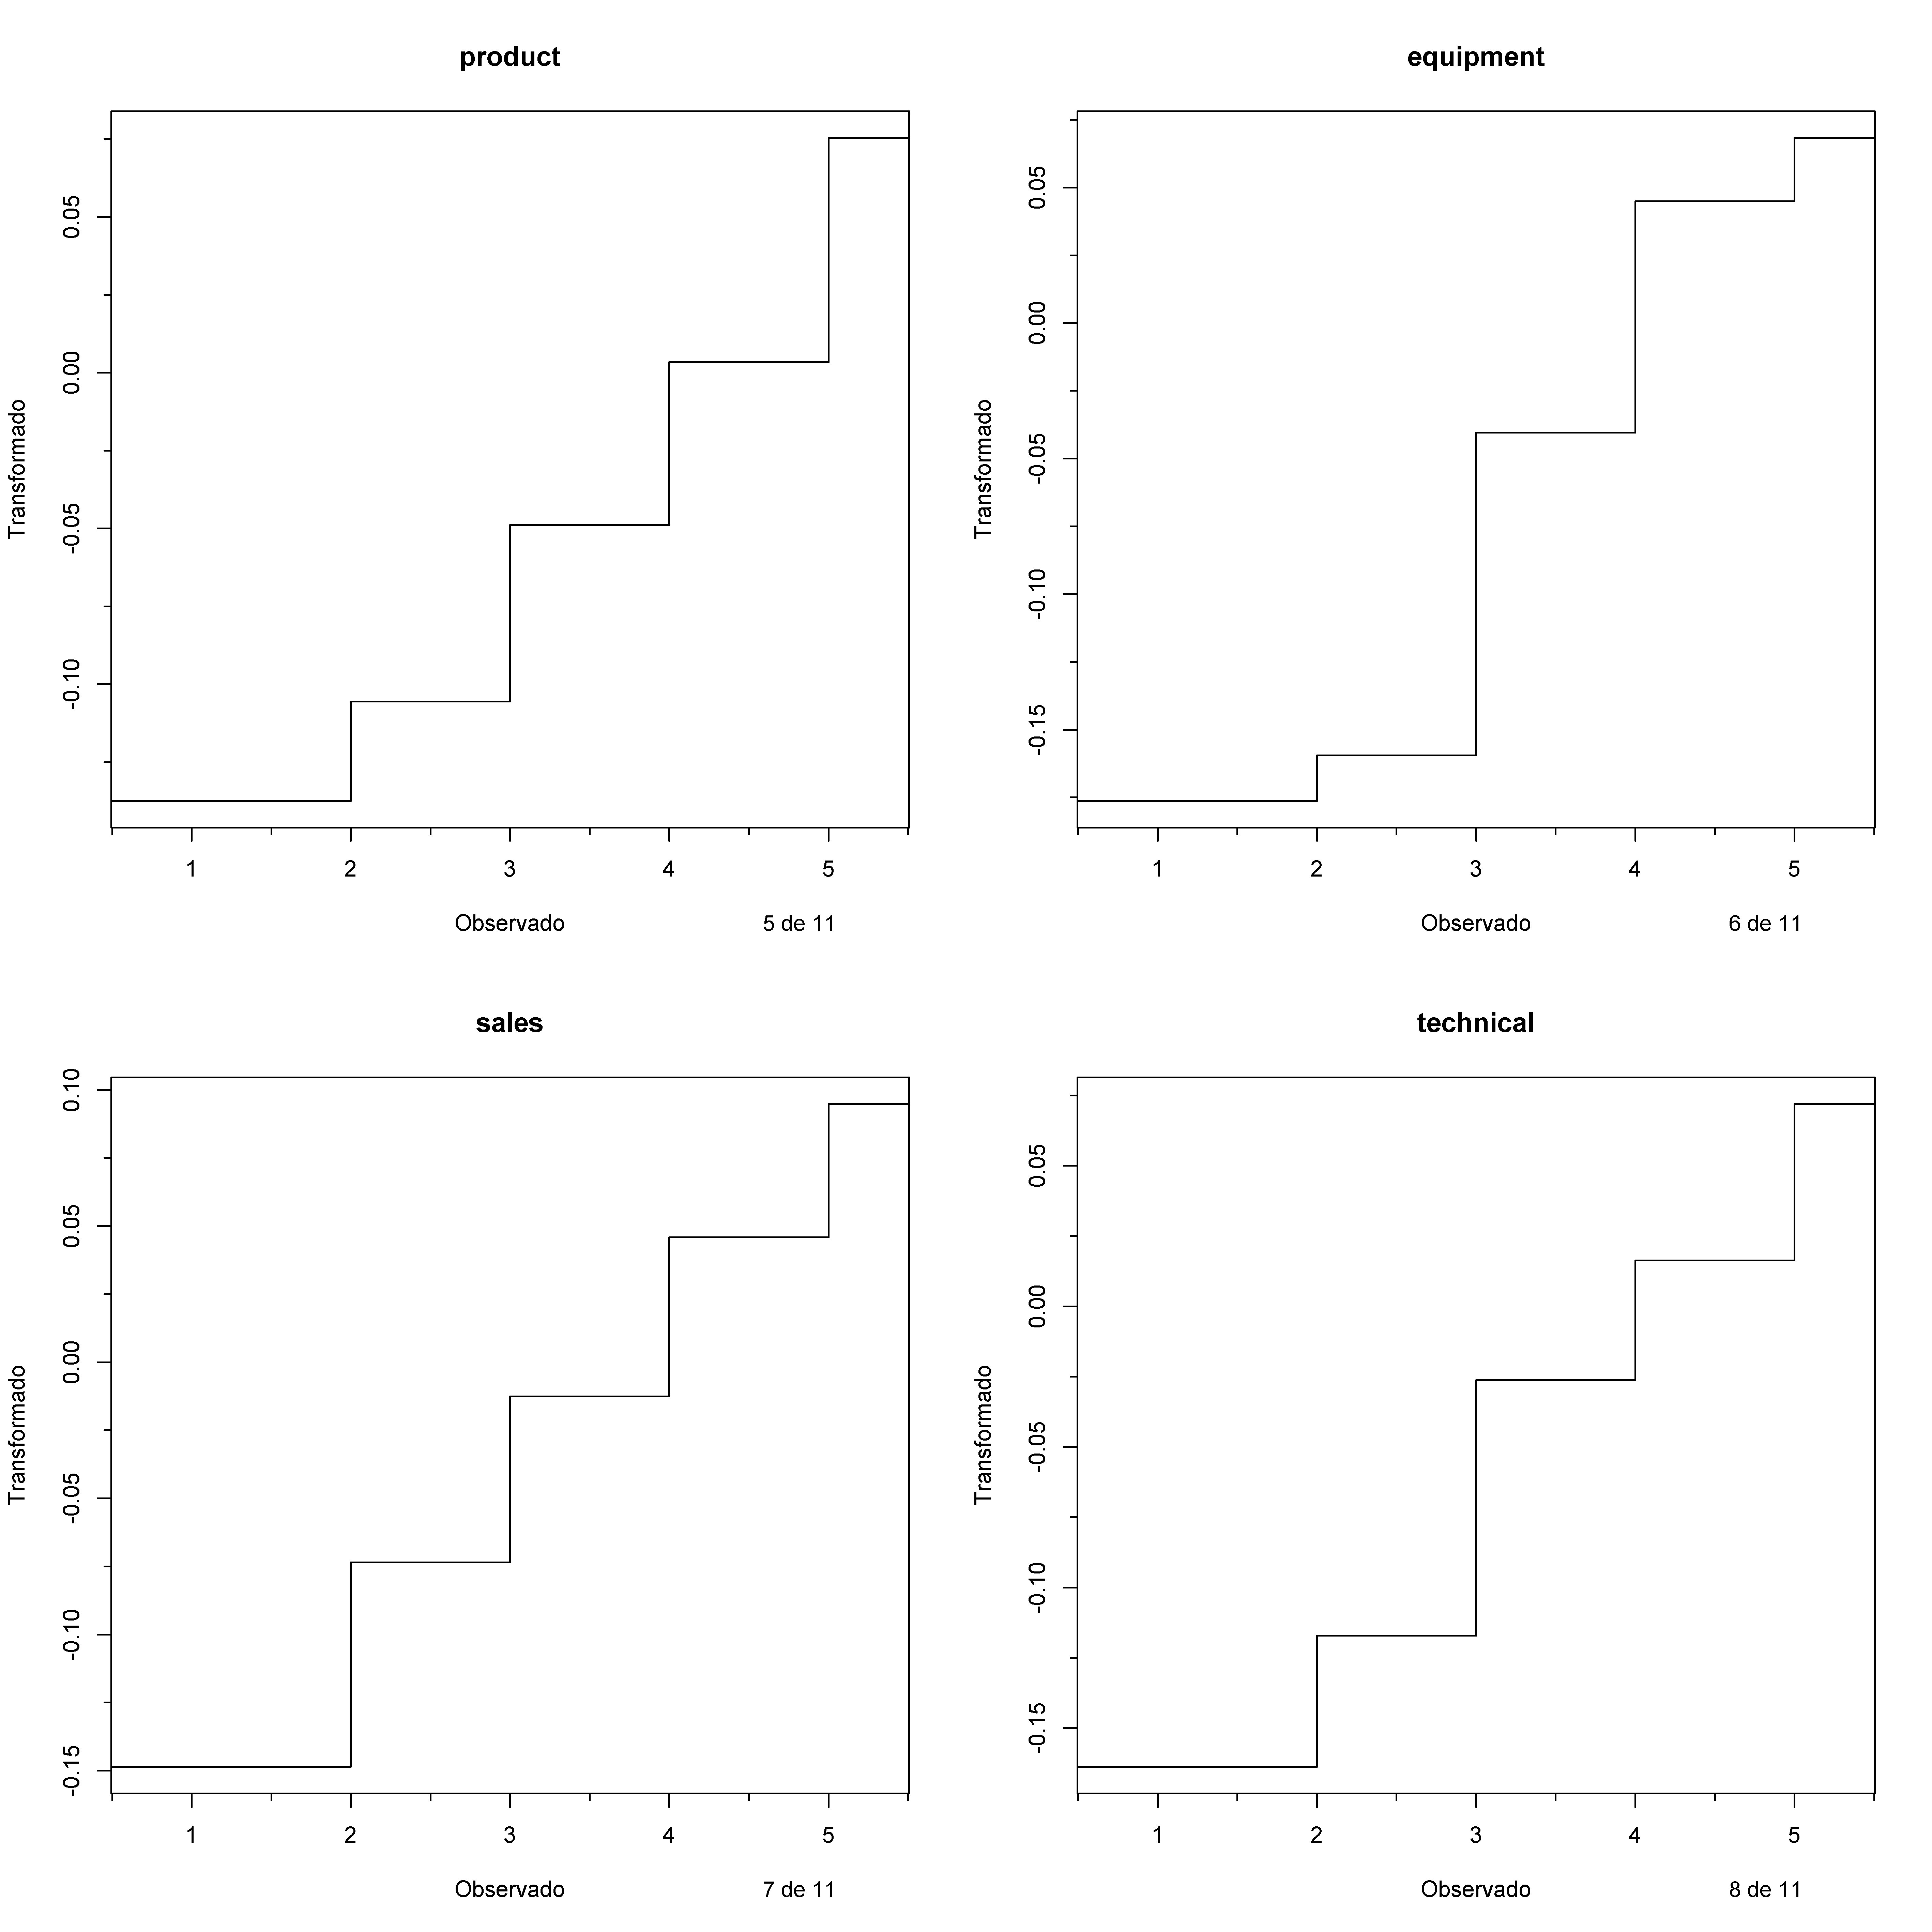
| Picture. Transplots of ABC dataset, just 5 to 8 variables |
 |
|---|
| Picture. Transplots of ABC dataset, just 9 to 11 variables |
 |
|---|
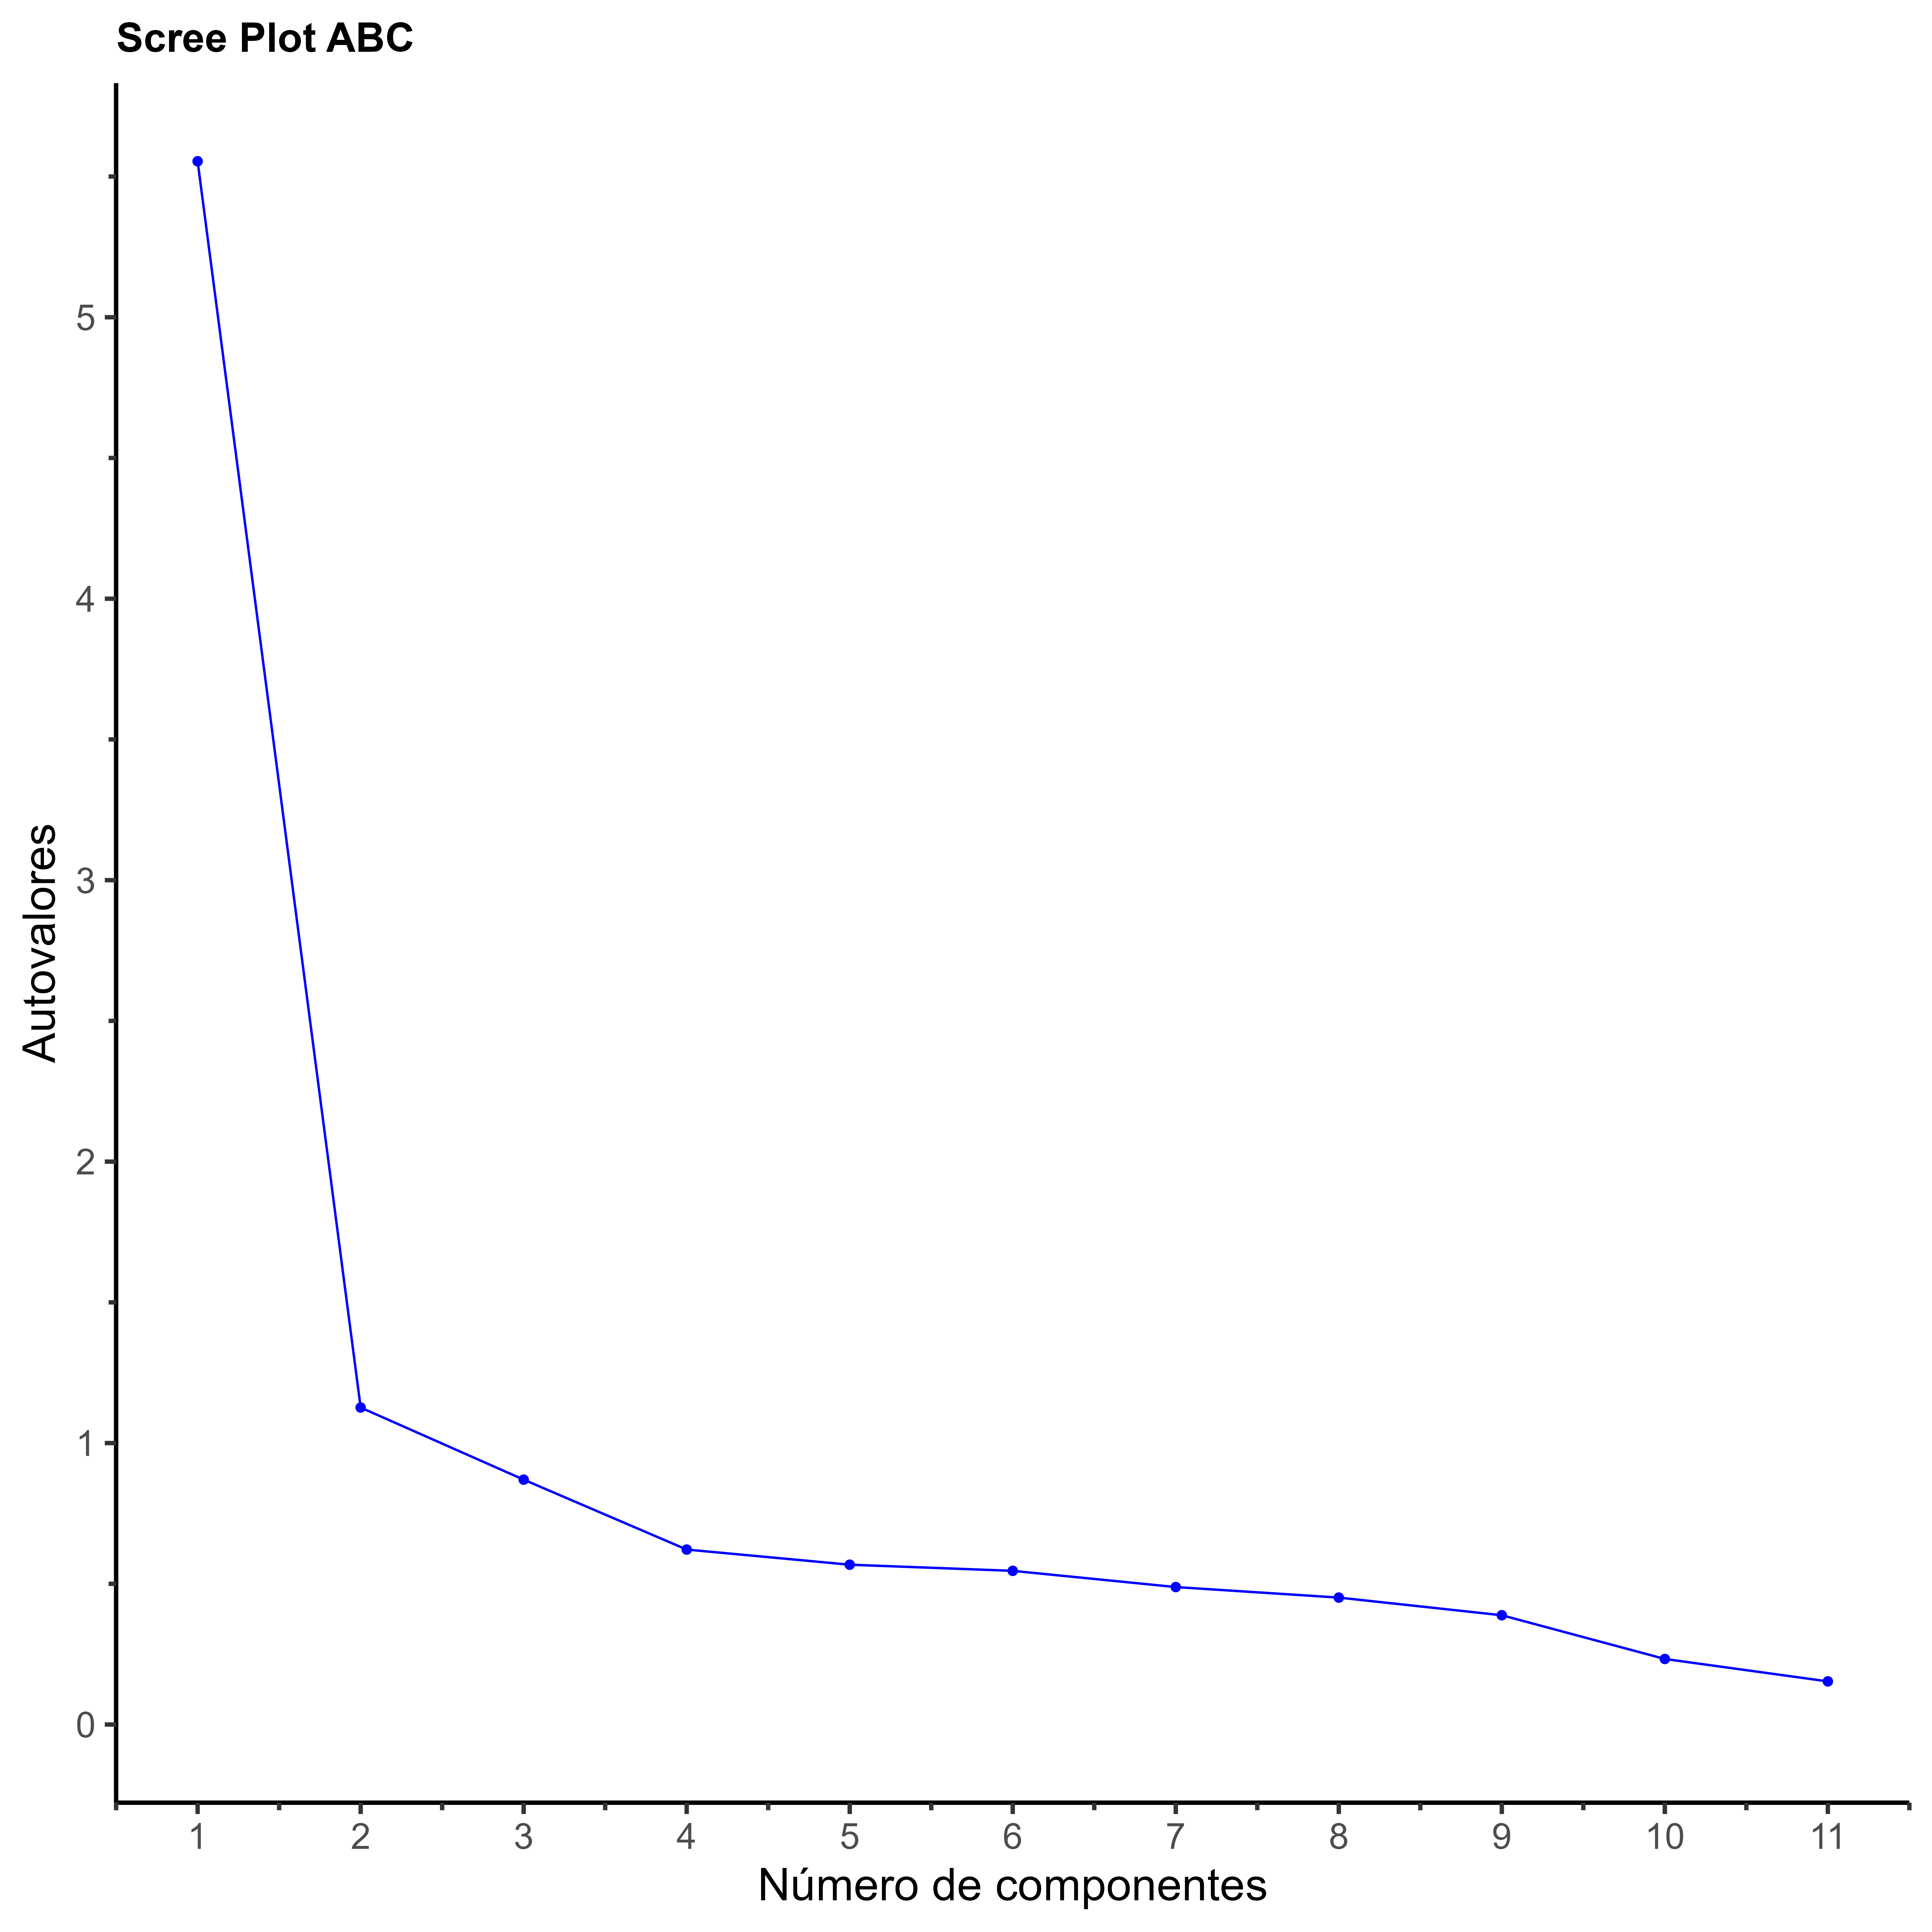
| Picture. Screeplot of ABC dataset |
 |
|---|
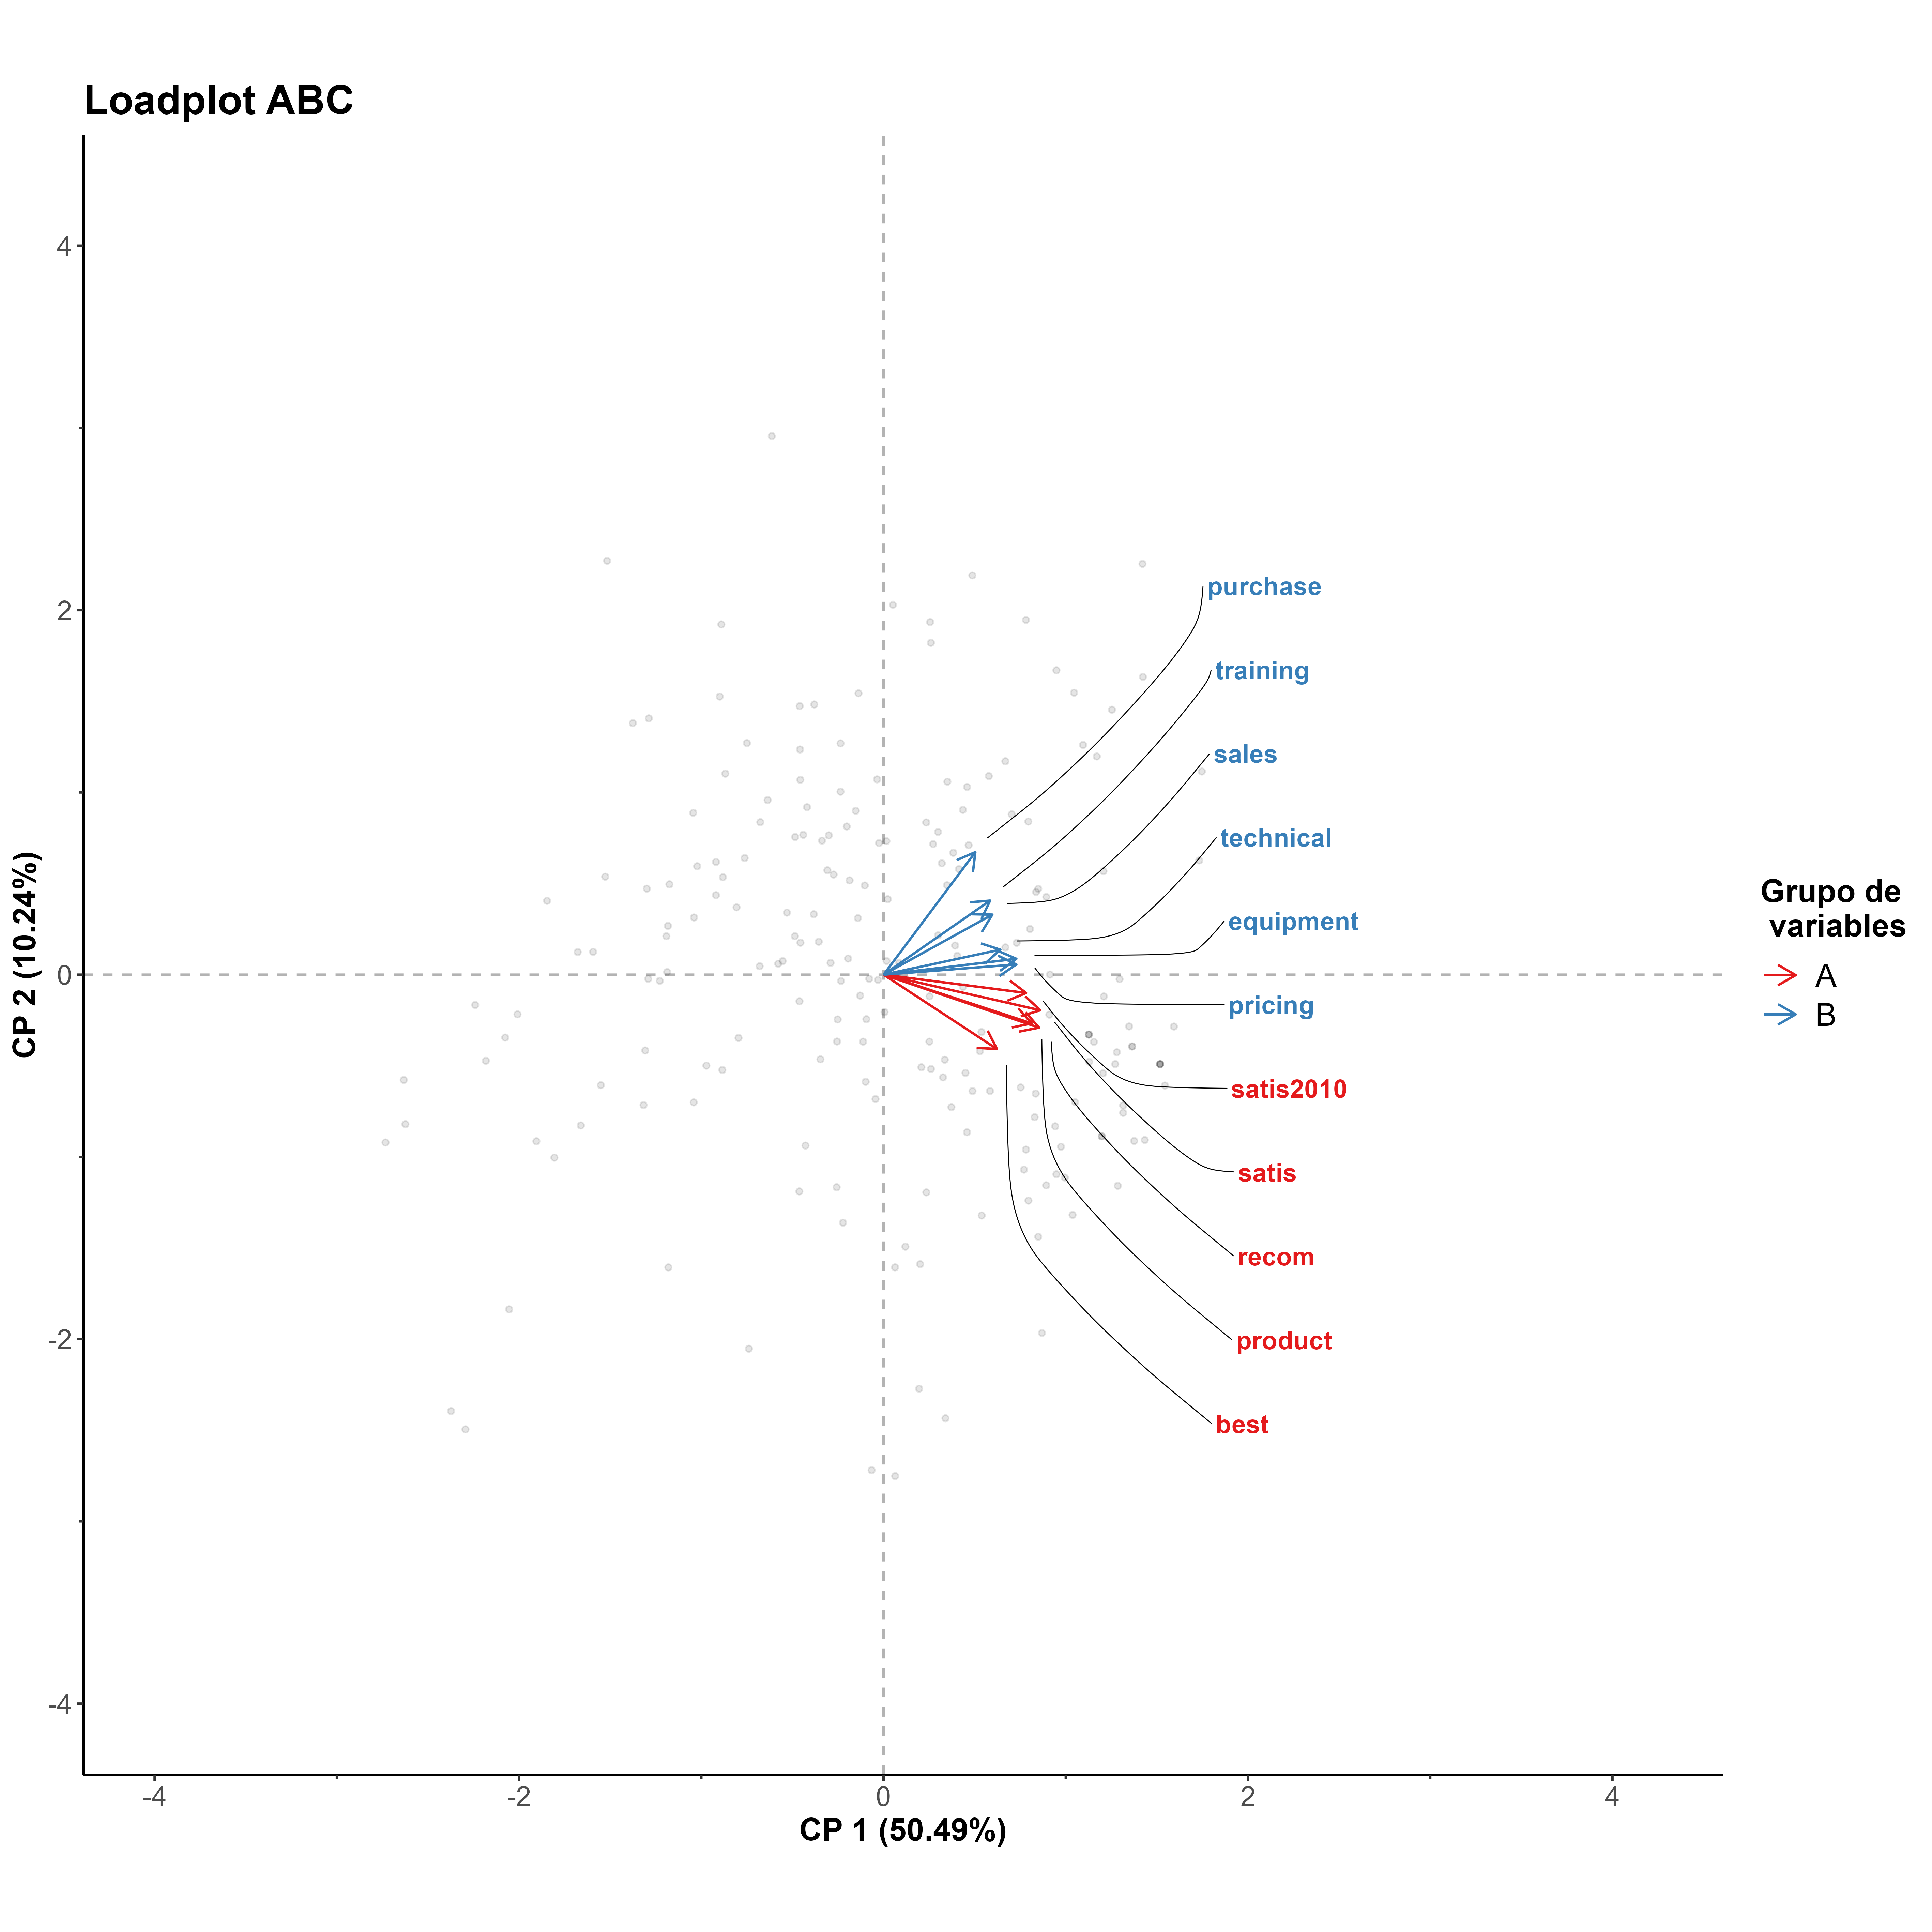
| Picture. Loadplot of ABC dataset |
 |
|---|
| Picture. Biplot of ABC dataset |