cygwin: stats.mapped is constantly increasing #1040
Comments
|
I think Cygwin might be a fundamentally screwy case for something like jemalloc, since our environment detection can get tricked into thinking we're unix-y in some cases, and windows-y in others. I don't know a ton about the environment; are you able to build jemalloc as a straight-windows .dll and link against it from your cygwin binary? (Is this your case 2?)? If so, it seems like this is an allocation pattern that can happen in a pure-windows environment, so that there's a problem with our Windows handling in general. |
|
Hello, David! Thank you for a quick response. Yes, I admit, Cygwin probably isn't a good choice, but... Anyway, let me elaborate the things further: |
|
Hmm. Yeah, I think we're in sort of uncharted territory here (the mmap and VirtualAlloc interfaces are sufficiently different as to require modified treatment w.r.t. allocation strategies, and getting a mix of both would be "interesting"). I think that compiling jemalloc.dll and wrapping in cygwin might not be as difficult as you fear -- we |
|
Well, I suppose there shouldn't be such mixing of interfaces. At least, I was trying to avoid it as much as possible. All memory requests from my code and the libraries as well are directed to jemalloc interface (and there are no significant memory leaks have been discovered by jeprof), so I assume there shouldn't a significant number of calls to mmap was made (Here I'm takling about jemalloc being compiled with |

|
A couple questions: Is the process consuming memory equal to "mapped" instead of "resident" (according to the windows statistics rather than jemalloc ones)? Could you post the malloc stats for the process? (In particular, I'm interested in some of the opt settings). |
|
I've decided to concentrate on the module compiled with
Hope this helps. I could try to build windows native dll (as you suggested later), but I'm still in doubts whether it really helps to resolve the puzzle, but I don't give up yet ː) Just a side note: the setting (I've also specified |

|
@interwq, anything in the malloc stats jumping out at you? |
|
Hello! Just noticed, that some of my unit tests are failing: This is something related to thread hooking, but does it capable to induce the observed effects? |
|
That's quite plausible. If you spin up a lot of threads that terminate without flushing their thread caches, you'd expect leaky behavior. Is that a likely explanation given your application behavior? (This is also something that could be caused by a feature misdetection scenario, which makes it promising as an explanation as well). |
|
It's really hard to tell... In fact, I use OpenMP, which holds a pool of 4 threads, whose (I believe) just goes to sleep when not needed and then wakes up later upon request. There are no massive thread creation activity during the program lifetime. As I said before, the same effect if observed in single thread mode as well, so I'm in doubt... Anyway, I will try to discover what is happening there and why the test fails. |
|
Nothing in the stats looks obviously wrong to me. The number of threads reported by jemalloc is 4, so doesn't look like the tsd issue is standing in the way. @j0t : can you experiment with one more option: "muzzy_decay_ms:0"? This is a relatively new feature and the stats there looks a bit suspicious. |
|
Hello interwq, thank you for response! |
|
Huh. So, this shouldn't solve the issue, but could get some useful data: could you post the graphs you see with the malloc conf of "muzzy_decay_ms:-1,dirty_decay_ms:-1"? |
|
No prob, David! Here it is: But still no significant change... |

|
I did some research related to unit test failure The test fails for both cases (i.e. when compiling either in 'pure Cygwin' or with _WIN32 macro defined), however, the reasons are very different.
from whereas jemalloc relies on
Nevertheless, I did managed to fix this by switching from Now However, all this doesn't give anything to my main issue, since thread creation/cleanup activity in my process is minimal. Now I have a plan to log the calls to Windows virtual memory management functions, maybe it helps to get a better understanding what is really happening. |
|
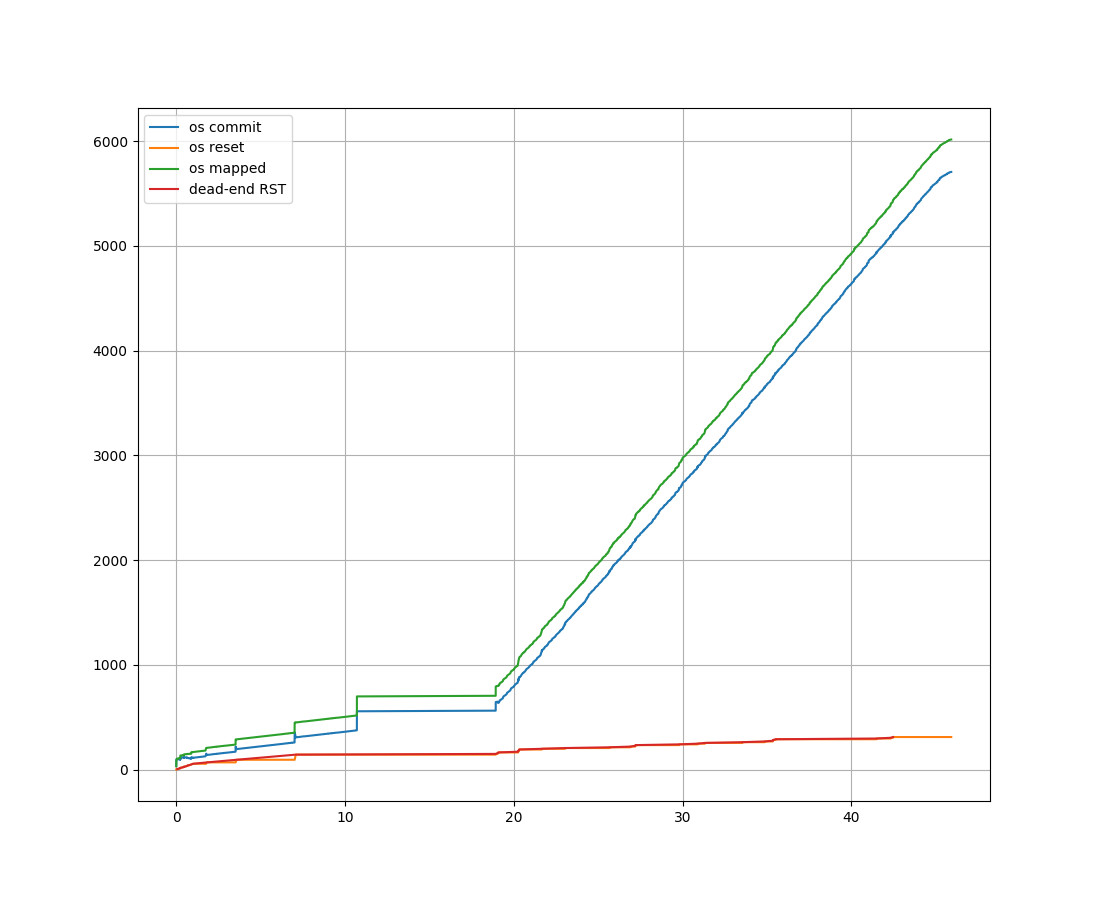
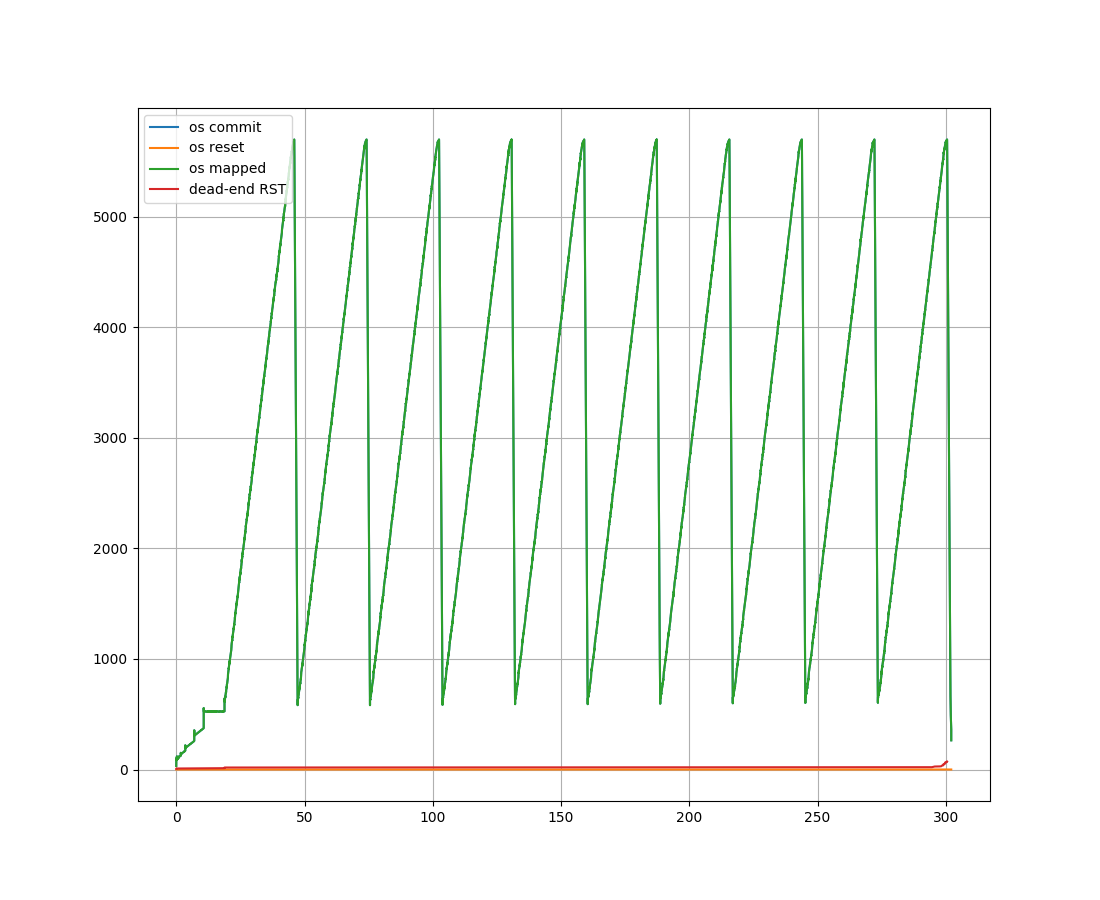
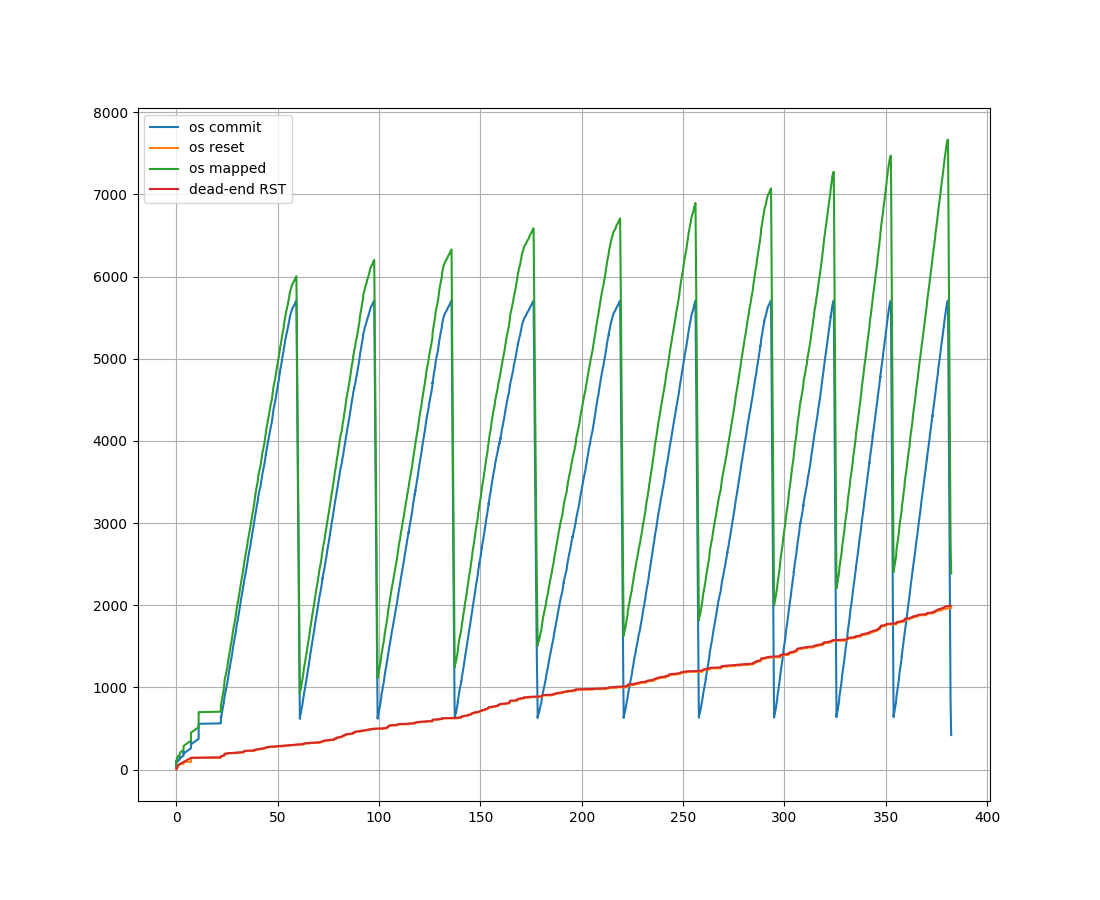
Hello, dear developers! Considering jemalloc as a grey box, finally I did some analysis of the particular input and output streams that flows through jemalloc at my application runtime. Application generates Specifically, in input we monitor It seems that amount of input events are just enormous (apx. 47*10^7 elements). In order to incorporate them in a reasonable way, we still process each event but sample current In output, all activity leads to the following WinAPI calls:
Here we monitor two variables: Naturally, the count of output events is not so big (apx. 75000 elements). The (unfortunate) results are here:
We see that
Could anyone comment this? Definitely, there as something wrong here... |

|
Hello again, |
|
Here is my 2 cents (resurrecting this issue). I'm pretty sure MEM_RESET in Windows does not work like madvise's MADV_FREE in Linux. I will expore this soon (becasue I need jemalloc to work on windows), but I am certain that windows API expects MEM_RESET_UNDO calls to explicitly reuse the memory that was offered via MEM_RESET. |
|
Hm, very interesting! Didn't heard about |
|
The leak is fixed in release 5.2.1, many thanks to all for that! :) |
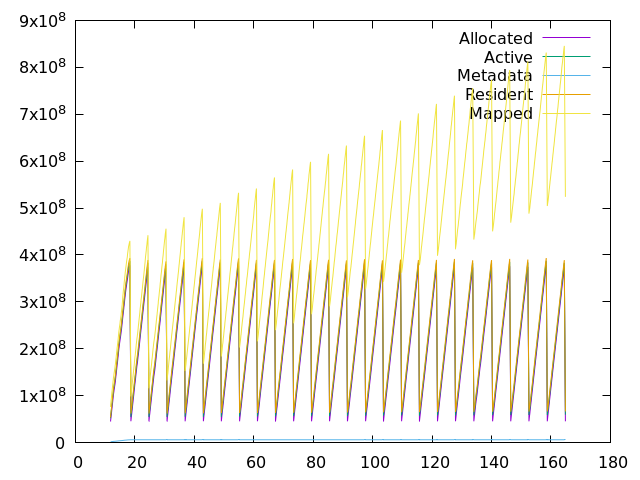
Hello, I've trying to utilize jemalloc with some project under Cygwin which uses memory in a quite intense manner in multi-threaded environment. It loads a number of data in memory, aggregates them in parallel, then frees all and then proceeds with next portion. While it shows an excellent CPU utilization due to the fact that each thread works inside its own arena, the process commit size exhibits a constantly increasing trend (Please see the statistics below).

It can be seen that stats.allocated and stats.resident are deviating in an expected way while stats.mapped behaves weirdly (at the end my swap file grows up to 160Gb while RAM usage is limited to some reasonable fixed amount). Could someone explain what is happening here? Since there are no trend in stats.allocated and stats.resident, I wouldn't suspect the process for a memory leaks. Is it a signs of an intense memory fragmentation? Or something else? If it helps, I would provide an additional statistics.
PS:
make EXTRA_CFLAGS=-D_WIN32, so it makes a direct calls to WinAPI for memory management from the Cygwin environment.make) makes the process run a little bit slower, but the effects are the same.The text was updated successfully, but these errors were encountered: