Profiles sometimes contain small negative weights #70
Comments
jlfwong
added a commit
that referenced
this issue
Jul 1, 2018
I'm not sure why this happens, but I have multiple profiles coming from Chrome that have negative values in the exported `timeDelta` objects.

This PR also cleans up some of the error reporting logic to hopefully stop logging `undefined` to the console on import failure.

Fixes #70
jlfwong
pushed a commit
that referenced
this issue
Aug 5, 2020
## Context Hi! I'm working on an experimental React [concurrent mode profiler](https://react-scheduling-profiler.vercel.app) in partnership with the React core team, and we're using a [custom build of Speedscope](taneliang/speedscope@master...taneliang:fork-for-scheduling-profiler) that exposes Speedscope's internals to support our custom flamechart rendering. Specifically, Speedscope is used to import and process Chrome profiles, which are then fed to our rendering code that draws everything to a canvas. Here's a screenshot of our app for context. The stuff above the thick gray bar is React data (some React Fiber lanes, React events, and other user timing marks), and a flamechart is drawn below. 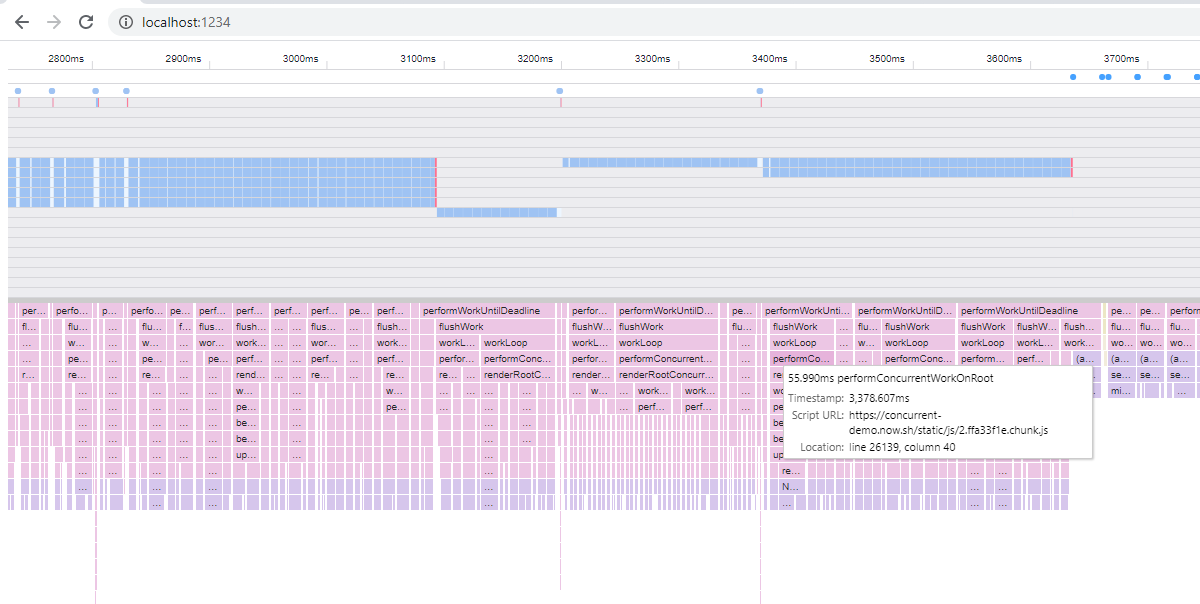 ## Problem Early on, we had [an issue](MLH-Fellowship/scheduling-profiler-prototype#42) where our flamechart was not aligned with the React data. The discrepancy between the flamechart frames and our React data grew over the time of the profile. We tracked down the cause to #80, which resolves #70. It seems like zeroing out those negative time deltas resulted in the accumulation of errors over the time of these profiles, which resulted in the very visible misalignment in our profiler. I am confident that the React data's timestamps are correct because they are obtained from User Timing marks, which have absolute timestamps and are thus independent of any `timeDelta` stuff. This would mean that Speedscope is likely displaying incorrect timestamps for Chrome profiles. ## Solution This PR takes a different approach to solving the negative `timeDelta` problem: we add a `lastElapsed` variable as a sort of backstop, preventing `elapsed` from traveling backwards in time, while still ensuring that `elapsed` is always accurate. We've been using this patch in our custom build for about a month now and it seems to work well.
jackerghan
pushed a commit
to jackerghan/speedscope
that referenced
this issue
Jul 28, 2023
## Context Hi! I'm working on an experimental React [concurrent mode profiler](https://react-scheduling-profiler.vercel.app) in partnership with the React core team, and we're using a [custom build of Speedscope](taneliang/speedscope@master...taneliang:fork-for-scheduling-profiler) that exposes Speedscope's internals to support our custom flamechart rendering. Specifically, Speedscope is used to import and process Chrome profiles, which are then fed to our rendering code that draws everything to a canvas. Here's a screenshot of our app for context. The stuff above the thick gray bar is React data (some React Fiber lanes, React events, and other user timing marks), and a flamechart is drawn below.  ## Problem Early on, we had [an issue](MLH-Fellowship/scheduling-profiler-prototype#42) where our flamechart was not aligned with the React data. The discrepancy between the flamechart frames and our React data grew over the time of the profile. We tracked down the cause to jlfwong#80, which resolves jlfwong#70. It seems like zeroing out those negative time deltas resulted in the accumulation of errors over the time of these profiles, which resulted in the very visible misalignment in our profiler. I am confident that the React data's timestamps are correct because they are obtained from User Timing marks, which have absolute timestamps and are thus independent of any `timeDelta` stuff. This would mean that Speedscope is likely displaying incorrect timestamps for Chrome profiles. ## Solution This PR takes a different approach to solving the negative `timeDelta` problem: we add a `lastElapsed` variable as a sort of backstop, preventing `elapsed` from traveling backwards in time, while still ensuring that `elapsed` is always accurate. We've been using this patch in our custom build for about a month now and it seems to work well.
Sign up for free
to join this conversation on GitHub.
Already have an account?
Sign in to comment
Not sure how this is happening
The text was updated successfully, but these errors were encountered: