Fix accumulated errors in Chrome profile imports caused by zeroed negative timeDeltas #305
Conversation
|
Hi @taneliang! Thanks for the thorough description of the problem & the fix! I'll try to take a look at this later this week. Knowing that it's battle tested on your own projects definitely helps! The high-level rationale makes sense to me, but I'll need to think a little more about the implementation to make sure it doesn't break assumptions elsewhere.
I'm afraid I don't want to support this. I'd consider supporting the solution described in #16 that largely views speedscope as a blackbox to inject into the DOM, but I'd rather not have any larger surface area than that which I have some amount of contract to maintain, including any of the interfaces around profile imports. That said, I'm glad you've found use in the code, and you're of course more than welcome to crib whatever bits are useful. |
|
Thanks @jlfwong!
I completely understand! Thanks for considering it anyway :) |
|
Okay, this is merged! I did a few small tweaks in f55c53f just for naming & comments in case you want to keep your fork up to date for those files. Thanks again for the fix & the thorough explanation. |
|
Thanks @jlfwong for the quick turnaround! |
## Context Hi! I'm working on an experimental React [concurrent mode profiler](https://react-scheduling-profiler.vercel.app) in partnership with the React core team, and we're using a [custom build of Speedscope](taneliang/speedscope@master...taneliang:fork-for-scheduling-profiler) that exposes Speedscope's internals to support our custom flamechart rendering. Specifically, Speedscope is used to import and process Chrome profiles, which are then fed to our rendering code that draws everything to a canvas. Here's a screenshot of our app for context. The stuff above the thick gray bar is React data (some React Fiber lanes, React events, and other user timing marks), and a flamechart is drawn below. 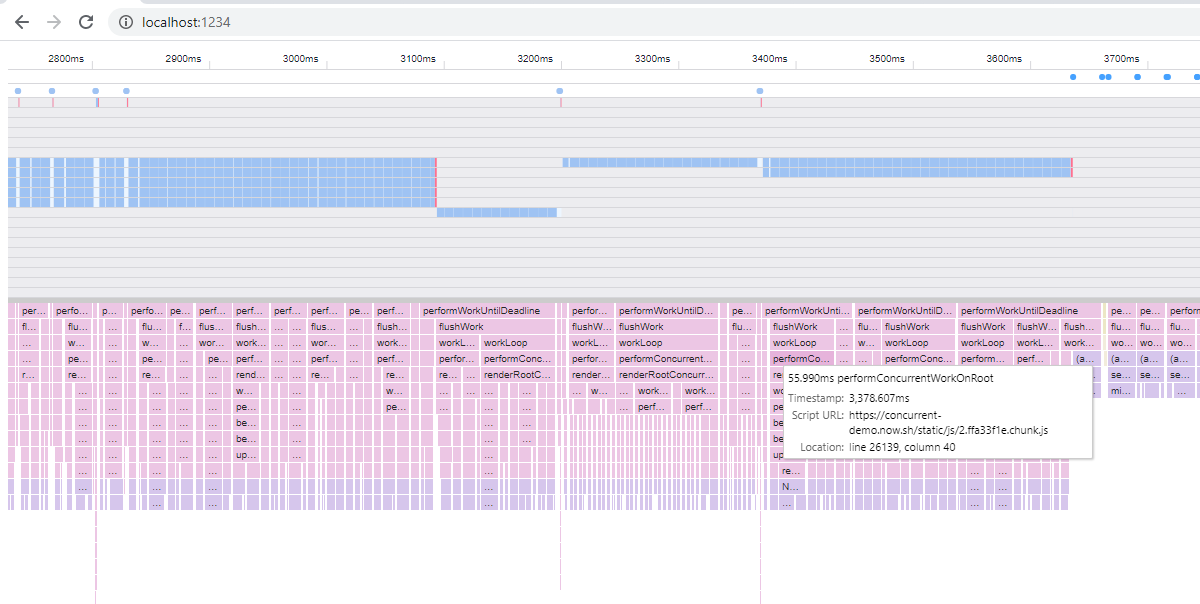 ## Problem Early on, we had [an issue](MLH-Fellowship/scheduling-profiler-prototype#42) where our flamechart was not aligned with the React data. The discrepancy between the flamechart frames and our React data grew over the time of the profile. We tracked down the cause to jlfwong#80, which resolves jlfwong#70. It seems like zeroing out those negative time deltas resulted in the accumulation of errors over the time of these profiles, which resulted in the very visible misalignment in our profiler. I am confident that the React data's timestamps are correct because they are obtained from User Timing marks, which have absolute timestamps and are thus independent of any `timeDelta` stuff. This would mean that Speedscope is likely displaying incorrect timestamps for Chrome profiles. ## Solution This PR takes a different approach to solving the negative `timeDelta` problem: we add a `lastElapsed` variable as a sort of backstop, preventing `elapsed` from traveling backwards in time, while still ensuring that `elapsed` is always accurate. We've been using this patch in our custom build for about a month now and it seems to work well.
Context
Hi! I'm working on an experimental React concurrent mode profiler in partnership with the React core team, and we're using a custom build of Speedscope that exposes Speedscope's internals to support our custom flamechart rendering. Specifically, Speedscope is used to import and process Chrome profiles, which are then fed to our rendering code that draws everything to a canvas.
Here's a screenshot of our app for context. The stuff above the thick gray bar is React data (some React Fiber lanes, React events, and other user timing marks), and a flamechart is drawn below.
Problem
Early on, we had an issue where our flamechart was not aligned with the React data. The discrepancy between the flamechart frames and our React data grew over the time of the profile.
We tracked down the cause to #80, which resolves #70. It seems like zeroing out those negative time deltas resulted in the accumulation of errors over the time of these profiles, which resulted in the very visible misalignment in our profiler.
I am confident that the React data's timestamps are correct because they are obtained from User Timing marks, which have absolute timestamps and are thus independent of any
timeDeltastuff. This would mean that Speedscope is likely displaying incorrect timestamps for Chrome profiles.Solution
This PR takes a different approach to solving the negative
timeDeltaproblem: we add alastElapsedvariable as a sort of backstop, preventingelapsedfrom traveling backwards in time, while still ensuring thatelapsedis always accurate.We've been using this patch in our custom build for about a month now and it seems to work well.
Unknowns
I know we're not exactly using Speedscope in a supported way, but we hope this fix will also be useful enough to be upstreamed.
Separately, we'd also like to explore the possibility of exporting Speedscope internals so that we don't have to maintain our fork (I think this was discussed in #16); I'd be happy to make a separate PR to expose the components we need.
Thanks for all the work on this project!