Signalviewer
Use css-ncs-downsample to convert files from the ncs-format to files that the viewer can read. Use the option --q to specify the downsampling factor. If you specify --q 1, the file is converted without downsampling.
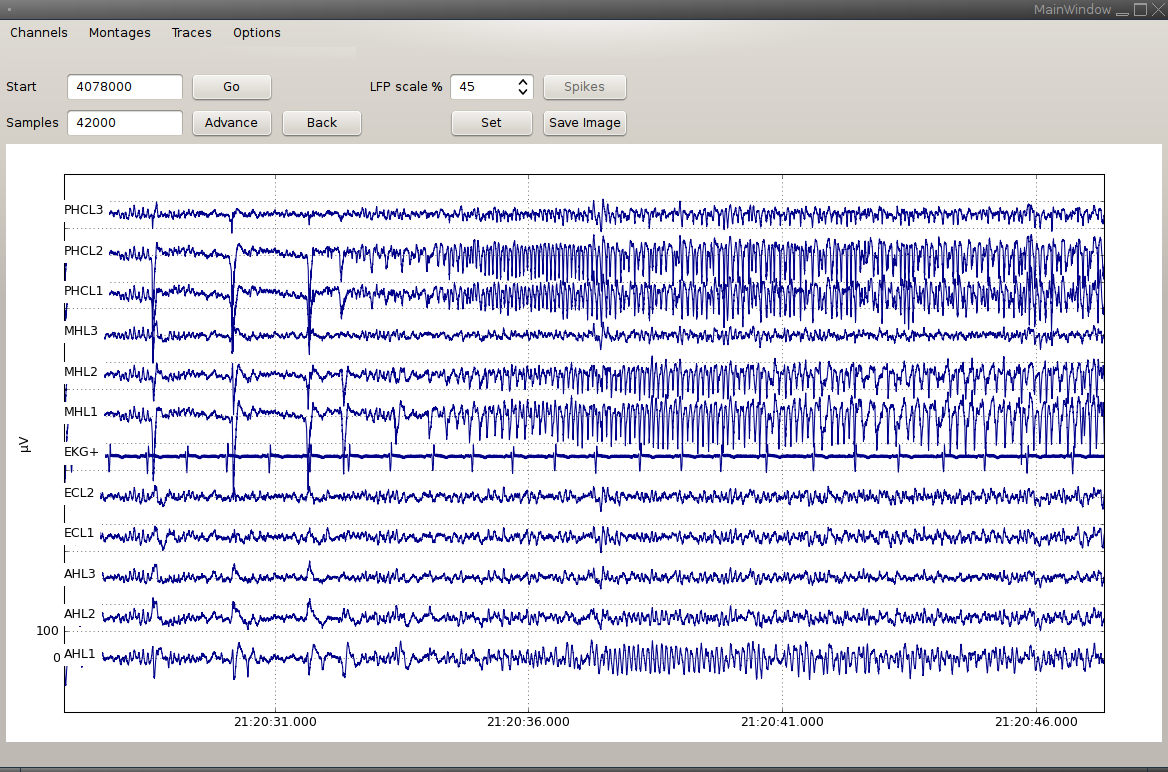
Start css-signalviewer in a directory containing converted files. The menu "Channels" lists all available channels.
The files read by the viewer contain a group data. Each array in data is understood as a trace for this one channel. In this way, you can add different filtered or re-referenced versions of the same channel. The traces to be displayed are read from a file traces.txt. Each line contains the name of a trace (equal to the name of the array in data) and a scaling factor for display. For example
rawdata 1
bandpass 5
envelope 5
would mean that for each channel, the viewer displays the traces rawdata, bandpass and envelope, scaling bandpass and envelope by a factor of 5.
To use a montage, create a file called my_montage.txt in the folder containing the converted files. Each line of the file contains either one channel name, such as LA1, or a difference of channel names, such as AHL1-AHL2.
The viewer lists all files with names ending in _montage.txt.
To view the recording with times from the wall clock, call parse_cheetah_logfile.py --write-datetime. This creates a file with the necessary time conversion information. You can then use the "Options" menu to enable the wall clock time.
Given a file CSC20_ds.h5, if there is a file CSC20_events.h5, the viewer plots events from this file. For each trace name, the viewer looks for an array named name, containing two columns: event starts and event stops.