Tutorial Synthetic Data
In this part of the tutorial, we will work with synthetic (simulated) data. We will work with the file that you can download here.
The simulated data was produced by Carlos Pedreira and colleagues. Details can be found in:
Pedreira, C., Martinez, J., Ison, M. J., Quian Quiroga, R.: "How many neurons can we see with current spike sorting algorithms?" Journal of Neuroscience Methods 211 (1), 2012. doi:10.1016/j.jneumeth.2012.07.010 http://www.sciencedirect.com/science/article/pii/S0165027012002749.
After downloading the simulated data, move the command prompt to the folder where you stored it and enter
css-extract --matfile simulation_5.mat --matfile-scale-factor 100.
There is now a folder simulation_5, containing one file data_simulation_5.h5.
The option --matfile-scale-factor 100 is necessary because Combinato assumes data to be stored in microvolts. To meet this requirement, the simulations used here have to be upscaled by a factor of 100.
If you would like to use your own Matlab file, store the data in a variable data and the sampling rate in a variable sr. If your data is not stored in microvolts already, use the --matfile-scale-factor option.
In this tutorial we try to keep things simple. So just enter
css-simple-clustering --datafile simulation_5/data_simulation_5.h5.
After a few seconds, the folder simulation_5 contains the sorted data.
Now we would like to see the output of the clustering procedure. There are two main ways for visualization: overview plots and the graphical user interface.
Enter
css-plot-sorted --label sort_pos_simple.
There is now a folder overview, containing just one plot:

The red numbers 1. through 4. point at a few problems with the clustering that we are going to solve in the next part of the tutorial.
Enter css-gui and click on File, Open. You will see a list containing just one file, our Simulation 5. Click on OK.
You will see this (or a similar) screen:
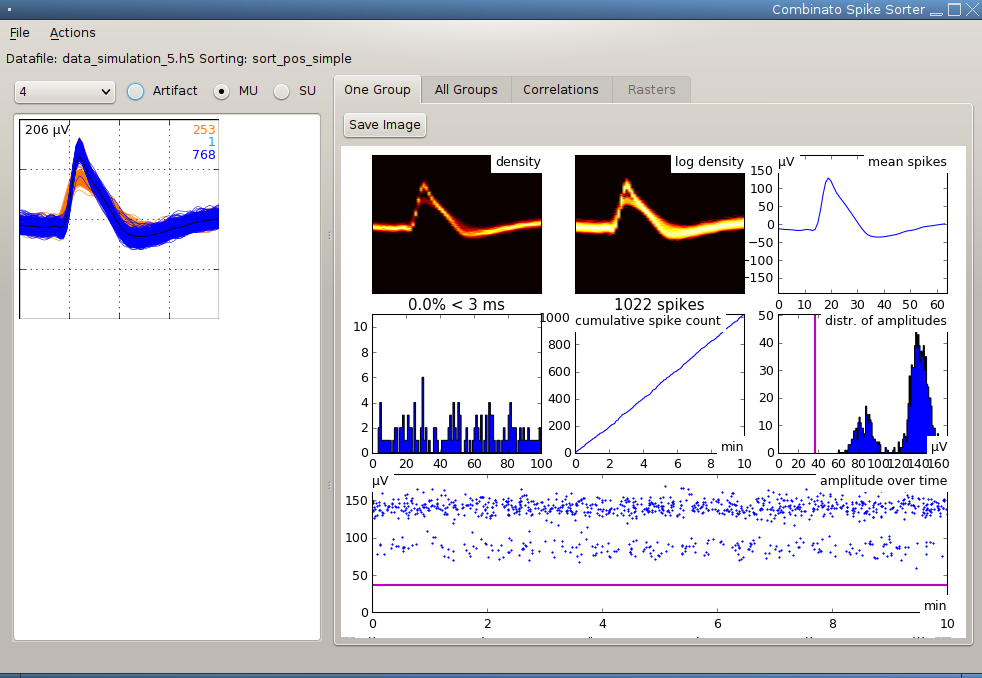
Go through the individual cluster groups by using the pull down menu. The plots on the right hand side update automatically. In our screenshot you can see that the unit displayed is "under-clustered": it should be split apart further. We are going to solve this problem in the next part of the tutorial.
Now, click on the "All Groups" tab. You will see this (or a similar) screen:
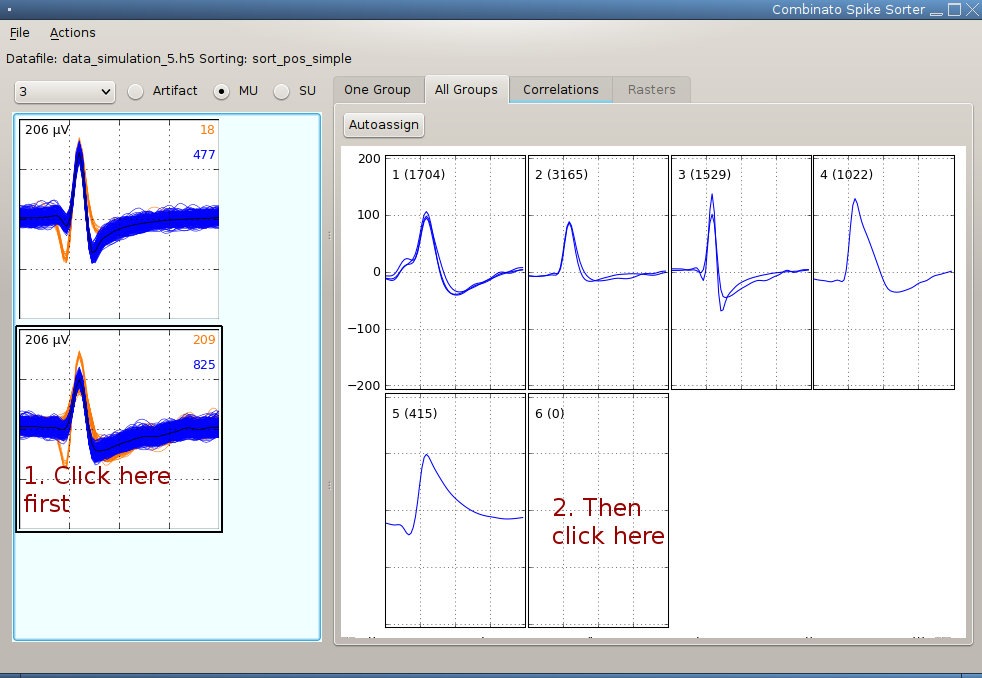 Here you see an overview of all cluster groups contained in Simulation 5. In some cases, clusters are grouped together in the wrong way. To solve this:
- First create a new group by clicking Actions, New Group.
- Then click on one of the clusters you would like to move to the new group (red 1. in the screenshot)
- The last step is to click into the new, empty group (red 2. in the screenshot).
You can save your modification by clicking File, Save.
Congratulations! You mastered Part I of the Tutorial. Go to Part II.