 Ono, Jorge P., Carlos Dietrich, and Claudio T. Silva. "Baseball Timeline: Summarizing Baseball Plays Into a Static Visualization." Computer Graphics Forum. Vol. 37. No. 3. 2018.
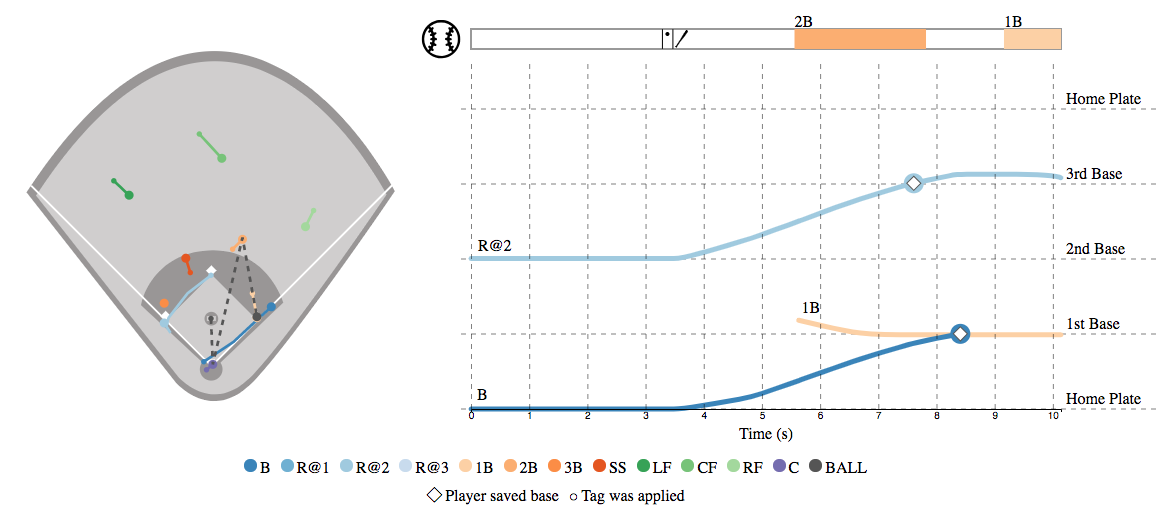
Visualization inspired by Mareys Train Schedule to visualize baseball plays. On the left, we see the player trajectories. On the right, player movement over time. The X axis represents time, and the Y axis, player position relative to the bases.
This code is provided with a hand annotated tracking data example. To run the code with the supplied example (example_tracking.csv), install the javascript dependencies using
npm install
and the python 2.7 dependencies
pip install cherrypy pandas
Then, in the console, run
python server.py
Open the browser, and type:
http://localhost:8000/?path=<path_to_example_tracking.csv>
for example, with the example.csv file in the root directory of user_1, run:
http://localhost:8000/?path=/home/user_1/example_tracking.csv