A data science project to predict rossman daily sales for up to six weeks in advance.
This dataset was originally used in a Kaggle competition and it was provided with historical sales data for 1,115 Rossmann stores. The task is to forecast the "Sales" column for the test set. However, here it was used to create a data science project. This project is part of the Seja um Data Scientist (Be a Data Scientist) course. It's a course that aims to prepare the data scientist for the process of a data science project.
Most of the fields are self-explanatory. The following are descriptions for those that aren't.
- Id - an Id that represents a (Store, Date) duple within the test set
- Store - a unique Id for each store
- Sales - the turnover for any given day (this is what you are predicting)
- Customers - the number of customers on a given day
- Open - an indicator for whether the store was open: 0 = closed, 1 = open
- StateHoliday - indicates a state holiday. Normally all stores, with few exceptions, are closed on state holidays. Note that all schools are closed on public holidays and weekends. a = public holiday, b = Easter holiday, c = Christmas, 0 = None
- SchoolHoliday - indicates if the (Store, Date) was affected by the closure of public schools
- StoreType - differentiates between 4 different store models: a, b, c, d
- Assortment - describes an assortment level: a = basic, b = extra, c = extended
- CompetitionDistance - distance in meters to the nearest competitor store
- CompetitionOpenSince[Month/Year] - gives the approximate year and month of the time the nearest competitor was opened
- Promo - indicates whether a store is running a promo on that day
- Promo2 - Promo2 is a continuing and consecutive promotion for some stores: 0 = store is not participating, 1 = store is participating
- Promo2Since[Year/Week] - describes the year and calendar week when the store started participating in Promo2
- PromoInterval - describes the consecutive intervals Promo2 is started, naming the months the promotion is started anew. E.g. "Feb,May,Aug,Nov" means each round starts in February, May, August, November of any given year for that store
This context was created by Meigarom during Data Science em Produção (Data Science in Production) Course. So this is a totally fictional context.
The stakeholder need investment in store renovation, but they don't know how much it will cost. Therefore they ask the data scientist to create a project to help them to idealize a solution for this problem, in other words, predict the sales for up to six weeks in advance. If they know the store's sales they can use part of the revenue to reinvest in renovation of the stores.
Create a data science project to predict daily sales for up to six weeks in advance.
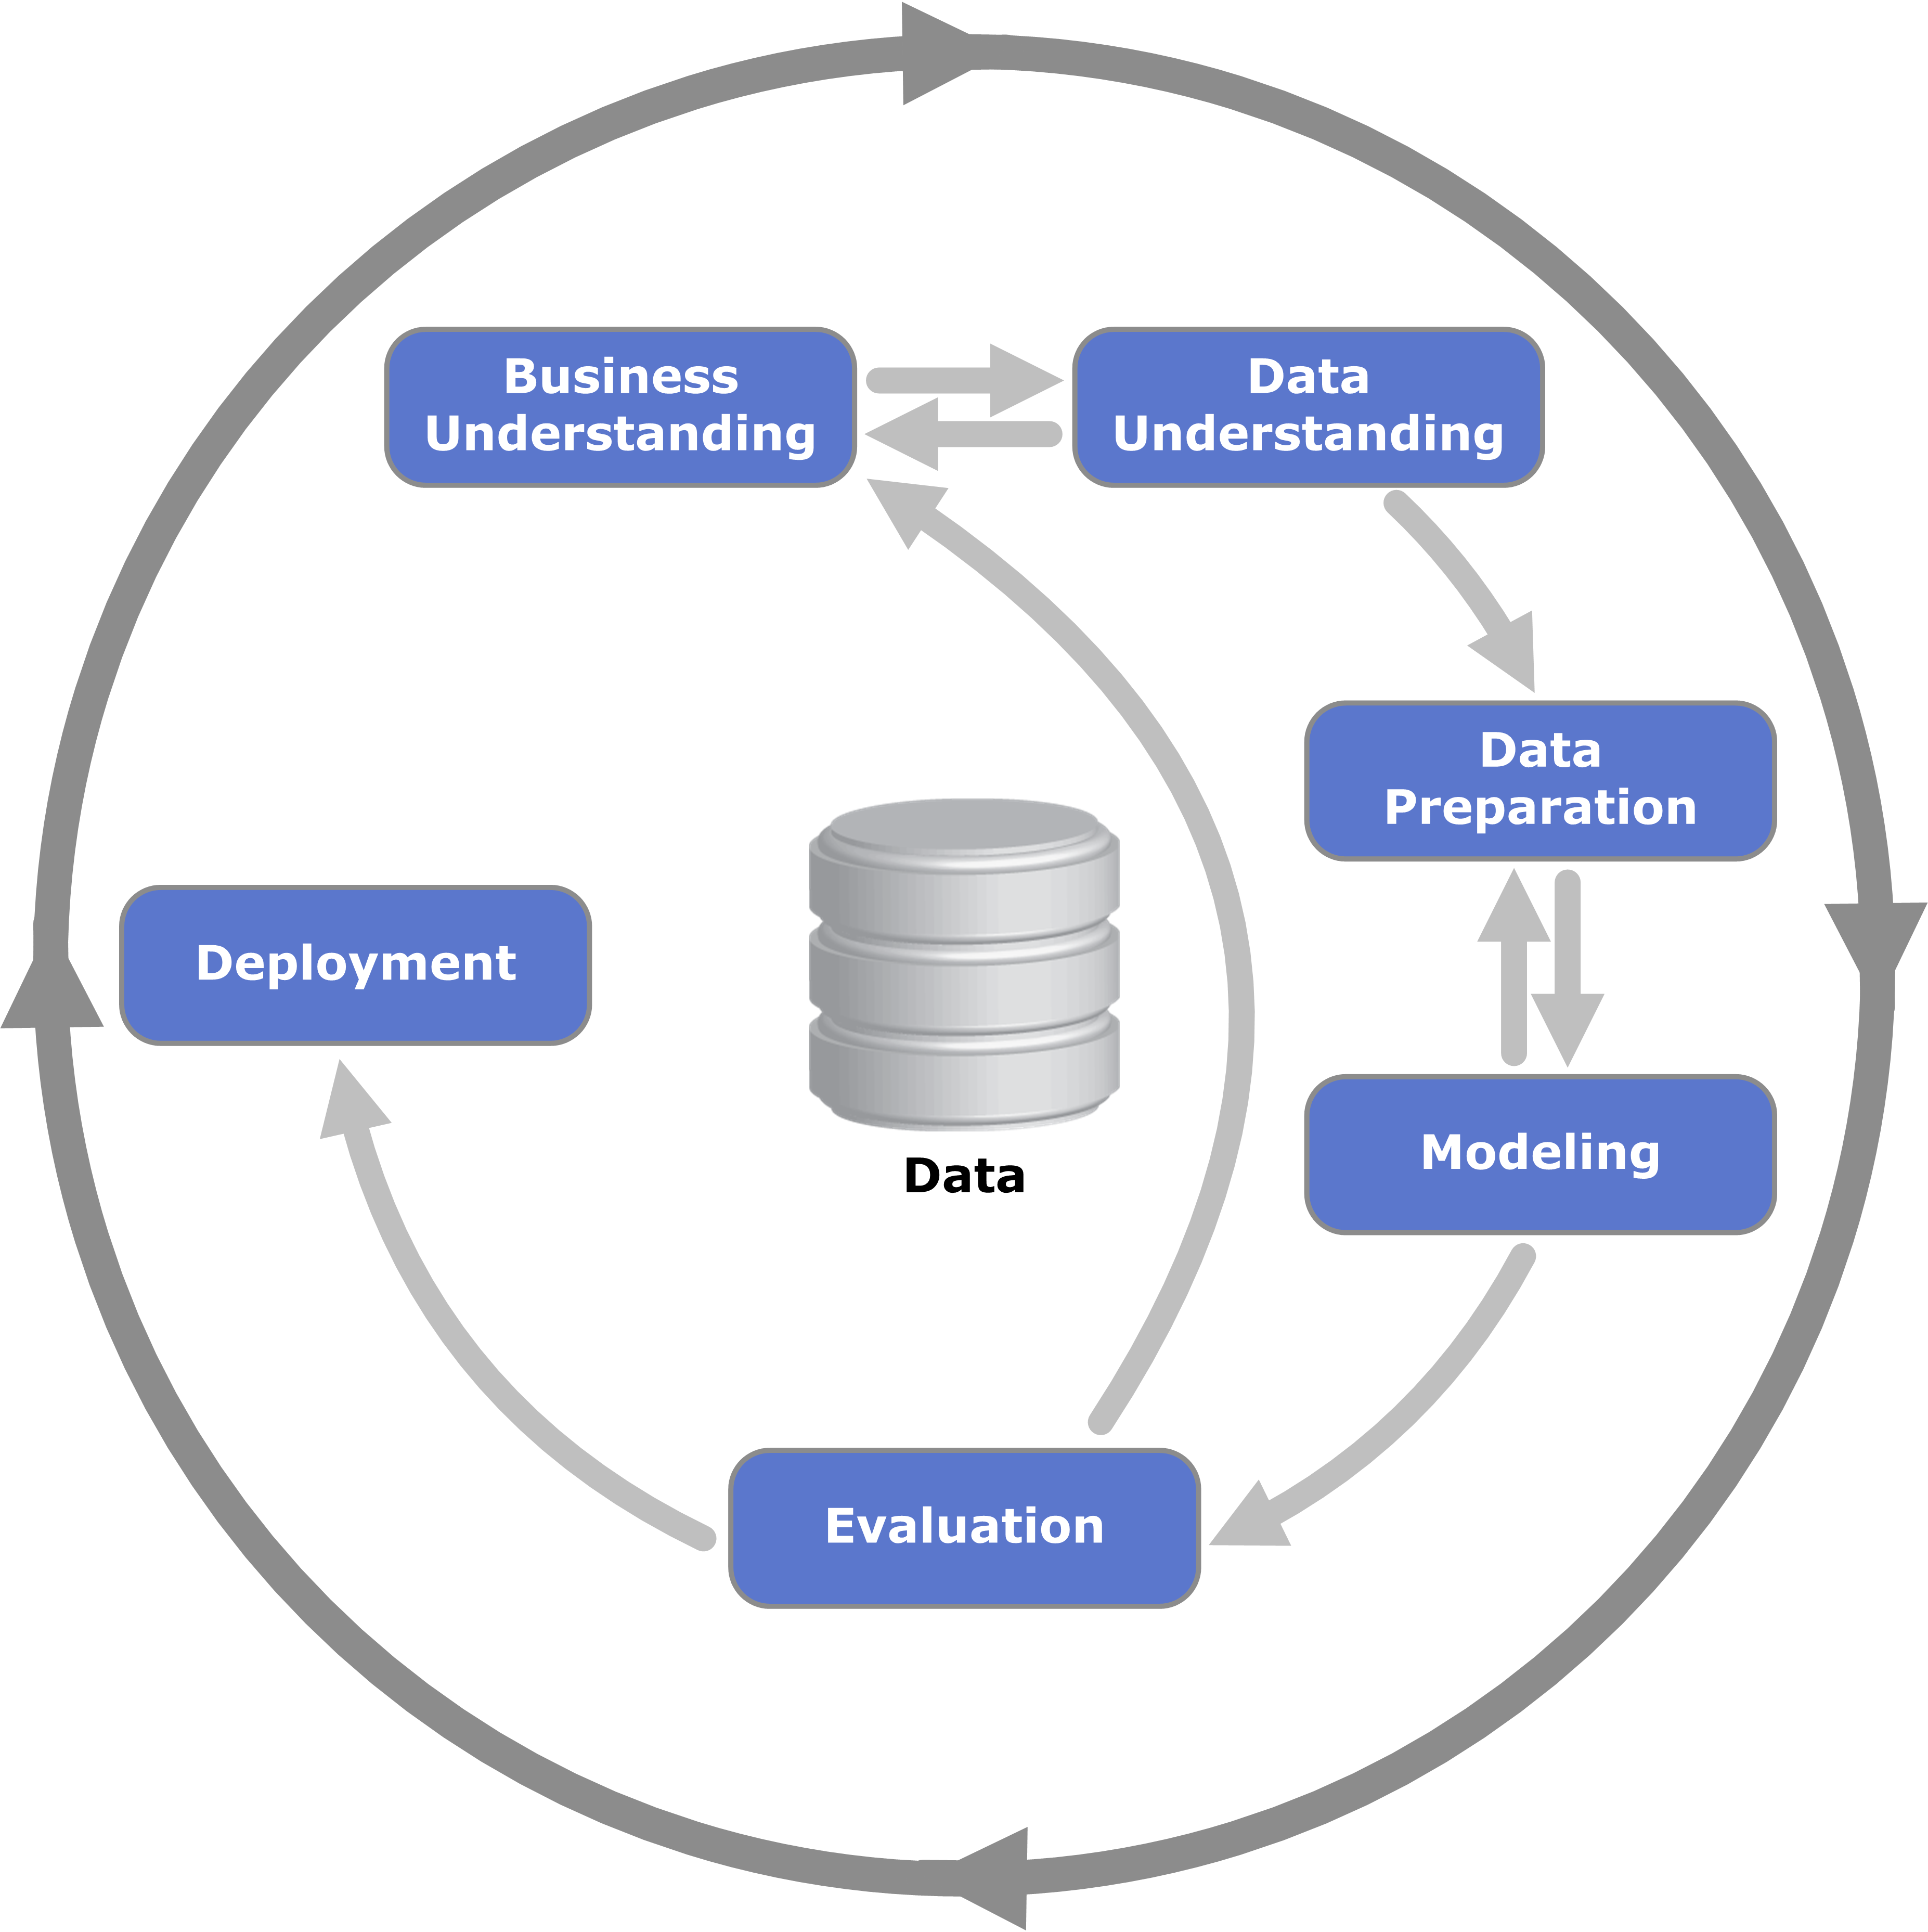
This project will be based on Cross-industry standard process for data mining (CRISP-DM). A standard idea about data science project may be linear: data preparation, modeling, evaluation and deployment. However, when we use CRISP-DM methodology a data science project become circle-like form. Even when it ends in Deployment, the project can restart again by Business Understanding. How might it help?
It may help to avoid the data scietist to stop in one specific step and wast time on it. When all the project is completed the data scientist can return to initial step and do every step again. Therefore, the main goal it is to follow circles as it needs.
-
Opening
-
Data Description
-
Feature Engineering
-
Data Analysis
-
Data Preparation
-
Feature Selection
-
Machine Learning Models
-
Hyperparameter Fine Tuning
-
Traduciton and Error's Interpretation
-
Model Deploy
This project is licensed under the MIT License - see the LICENSE file for details.

