SVG displays without tooltips #7497
Comments
|
I was bitten by this as i was trying to render But first, let's reproduce it with ipython code: >>> dot_txt = !echo 'digraph D { A [tooltip="Hi", URL="http://example.com"];}' | dot -Tsvg
>>> dot_txt = "\n".join(dot_txt)And we get this SVG content: <?xml version="1.0" encoding="UTF-8" standalone="no"?>
<!DOCTYPE svg PUBLIC "-//W3C//DTD SVG 1.1//EN"
"http://www.w3.org/Graphics/SVG/1.1/DTD/svg11.dtd">
<!-- Generated by graphviz version 2.43.0 (0)
-->
<!-- Title: D Pages: 1 -->
<svg width="62pt" height="44pt"
viewBox="0.00 0.00 62.00 44.00" xmlns="http://www.w3.org/2000/svg" xmlns:xlink="http://www.w3.org/1999/xlink">
<g id="graph0" class="graph" transform="scale(1 1) rotate(0) translate(4 40)">
<title>D</title>
<polygon fill="white" stroke="transparent" points="-4,4 -4,-40 58,-40 58,4 -4,4"/>
<!-- A -->
<g id="node1" class="node">
<title>A</title>
<g id="a_node1"><a xlink:href="http://example.com" xlink:title="Hi">
<ellipse fill="none" stroke="black" cx="27" cy="-18" rx="27" ry="18"/>
<text text-anchor="middle" x="27" y="-14.3" font-family="Times,serif" font-size="14.00">A</text>
</a>
</g>
</g>
</g>
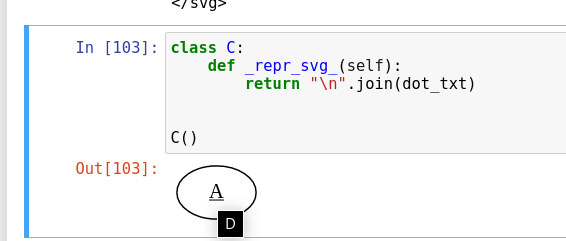
</svg>And when we try to render it: >>> class C:
... def _repr_svg_(self):
... return "\n".join(dot_txt)
>>> C().. neither the tootltip works, not the link (it is not underlined). While in Notebook, they are both working fine: And the reason is that the rendered SVG is embedded in an image from a data-url <div class="p-Widget jp-RenderedSVG jp-mod-trusted jp-OutputArea-output" data-mime-type="image/svg+xml"><img src="data:image/svg+xml,%3C%3Fxml%20version%3D ...></div>
WorkaroundAs hinted in #5589, use class C:
def _repr_html_(self):
return "\n".join(dot_txt) |

|
Thanks for finding #5589, with its discussion of the design decision and the workaround. |
|
@jasongrout an irrelevant comment, and without sounding too pedantic: |
|
As I saw it, this issue turned into a discussion about a design decision that was made, so is in the reference milestone as documentation and q&a about an existing design decision. If there was a clear thing to implement at some point in the future, I'd put it into the Future milestone. Do you see it differently? |
|
I think you misunderstood my comment :-) |
|
Ah. As far as I know, we haven't found a need for projects. Yes, it would be great to categorize it with any appropriate labels. As for milestones, you're right that an issue can only be in one milestone, so we use them to roughly estimate an answer to the question "what needs to be implemented in the codebase by when" (e.g., "needs something implemented eventually" vs "targeted for a specific release" vs "discussion valuable to archive as reference material", etc.) If you have some more specific suggestions about how we can organize things better (i.e., specific labels, or how we can effectively use projects, etc.), can you open a new issue on the team compass repo to discuss it? https://github.com/jupyterlab/team-compass/ |
bc could not simply implement _repr_svg_()
due to jupyterlab/jupyterlab#7497

+ feat(utils): +ifnone()
+ doc of new svg config-args.
|
FYI, in my code i converted the use of Maybe this could be polished and become the official way for rendering SVGs, instead of converting them to images, what do you think? |
|
Interesting, thanks for bringing this up. I'll also note you could write a JupyterLab extension to override the built-in svg renderer, so you wouldn't have to wait on any official decisions about core. |
bc could not simply implement _repr_svg_()
due to jupyterlab/jupyterlab#7497

+ feat(utils): +ifnone()
+ doc of new svg config-args.
|
Indeed, using HTML() instead of SVG will show the tooltip like in classic jupyter notebook: from IPython.core.display import HTML
HTML("""<svg viewBox="0 0 500 50">
<title> LONG NAME </title><text y="20"> short name </text>
</svg>""")Image: same like in the first post. |
bc could not simply implement _repr_svg_()
due to jupyterlab/jupyterlab#7497

+ feat(utils): +ifnone()
+ doc of new svg config-args.
Reproduce
Expected behavior
Appearing the tooltip "LONG NAME" if mouse pointer is over "short name" like in the classic notbook:

The text was updated successfully, but these errors were encountered: