Network-based systems pharmacology identifies heterogeneity in LCK and BCL2 signaling and differential vulnerability of T-ALL to targeted therapy
We set up an RNAseq data analysis pipeline using RSEM package.First BAM files from Discovery, Validation and TARGET cohorts were converted into FASTQ files by PICARD package. The alignment report were extracted and FPKM were used as the quantification result.
- See scripts: 00.rsem_RNAseq_pipeline.sh and 00.rsemQCreport.R
After run rsem_RNAseq_pipeline the raw data esets were created for the Discovery, Validationa and TARGET cohorts.
- See scripts: 01.Discovery_FPKM.eset.R; 02.Validation_FPKM.eset.R; 03.TARGET_FPKM.eset.R
T cell development expression profile was generated from GSE15907 dataset. 23 T cell development stages were selected by following the definition in supplementary table1 from the paper by Mingueneau et al.
- See script:04.Mouse.eset.R
5 PDX samples (3 sensitive cases and 2 resistant cases) were treated with or without Dasatinib (10nM, 1h) before multiplexed tandem-mass-tab(TMT) labeling. log2 transformed peptide intensity were used to create eset.
- See script: 05.PDX_phosphoproteomic.eset.R
We used the HTseq raw count data from Liu’s paper. Each sample raw counts were scaled up to 50M before log2 transfomation (with psudocount of one). None informative features were filted out before building T-ALL specific network.
- See scripts: 01.SJARACNeInputPreparation.R
We used SJARACNe to build T-ALL specific transcriptional and signaling networks seperately.
- See scripts: 02.SJARACNEnetwork.sh
NetBID were used to extract transcriptional and signaling networks from SJARACNe results and two networks were merged into one.
- See scripts: 03.CreateTALLnetwork.R
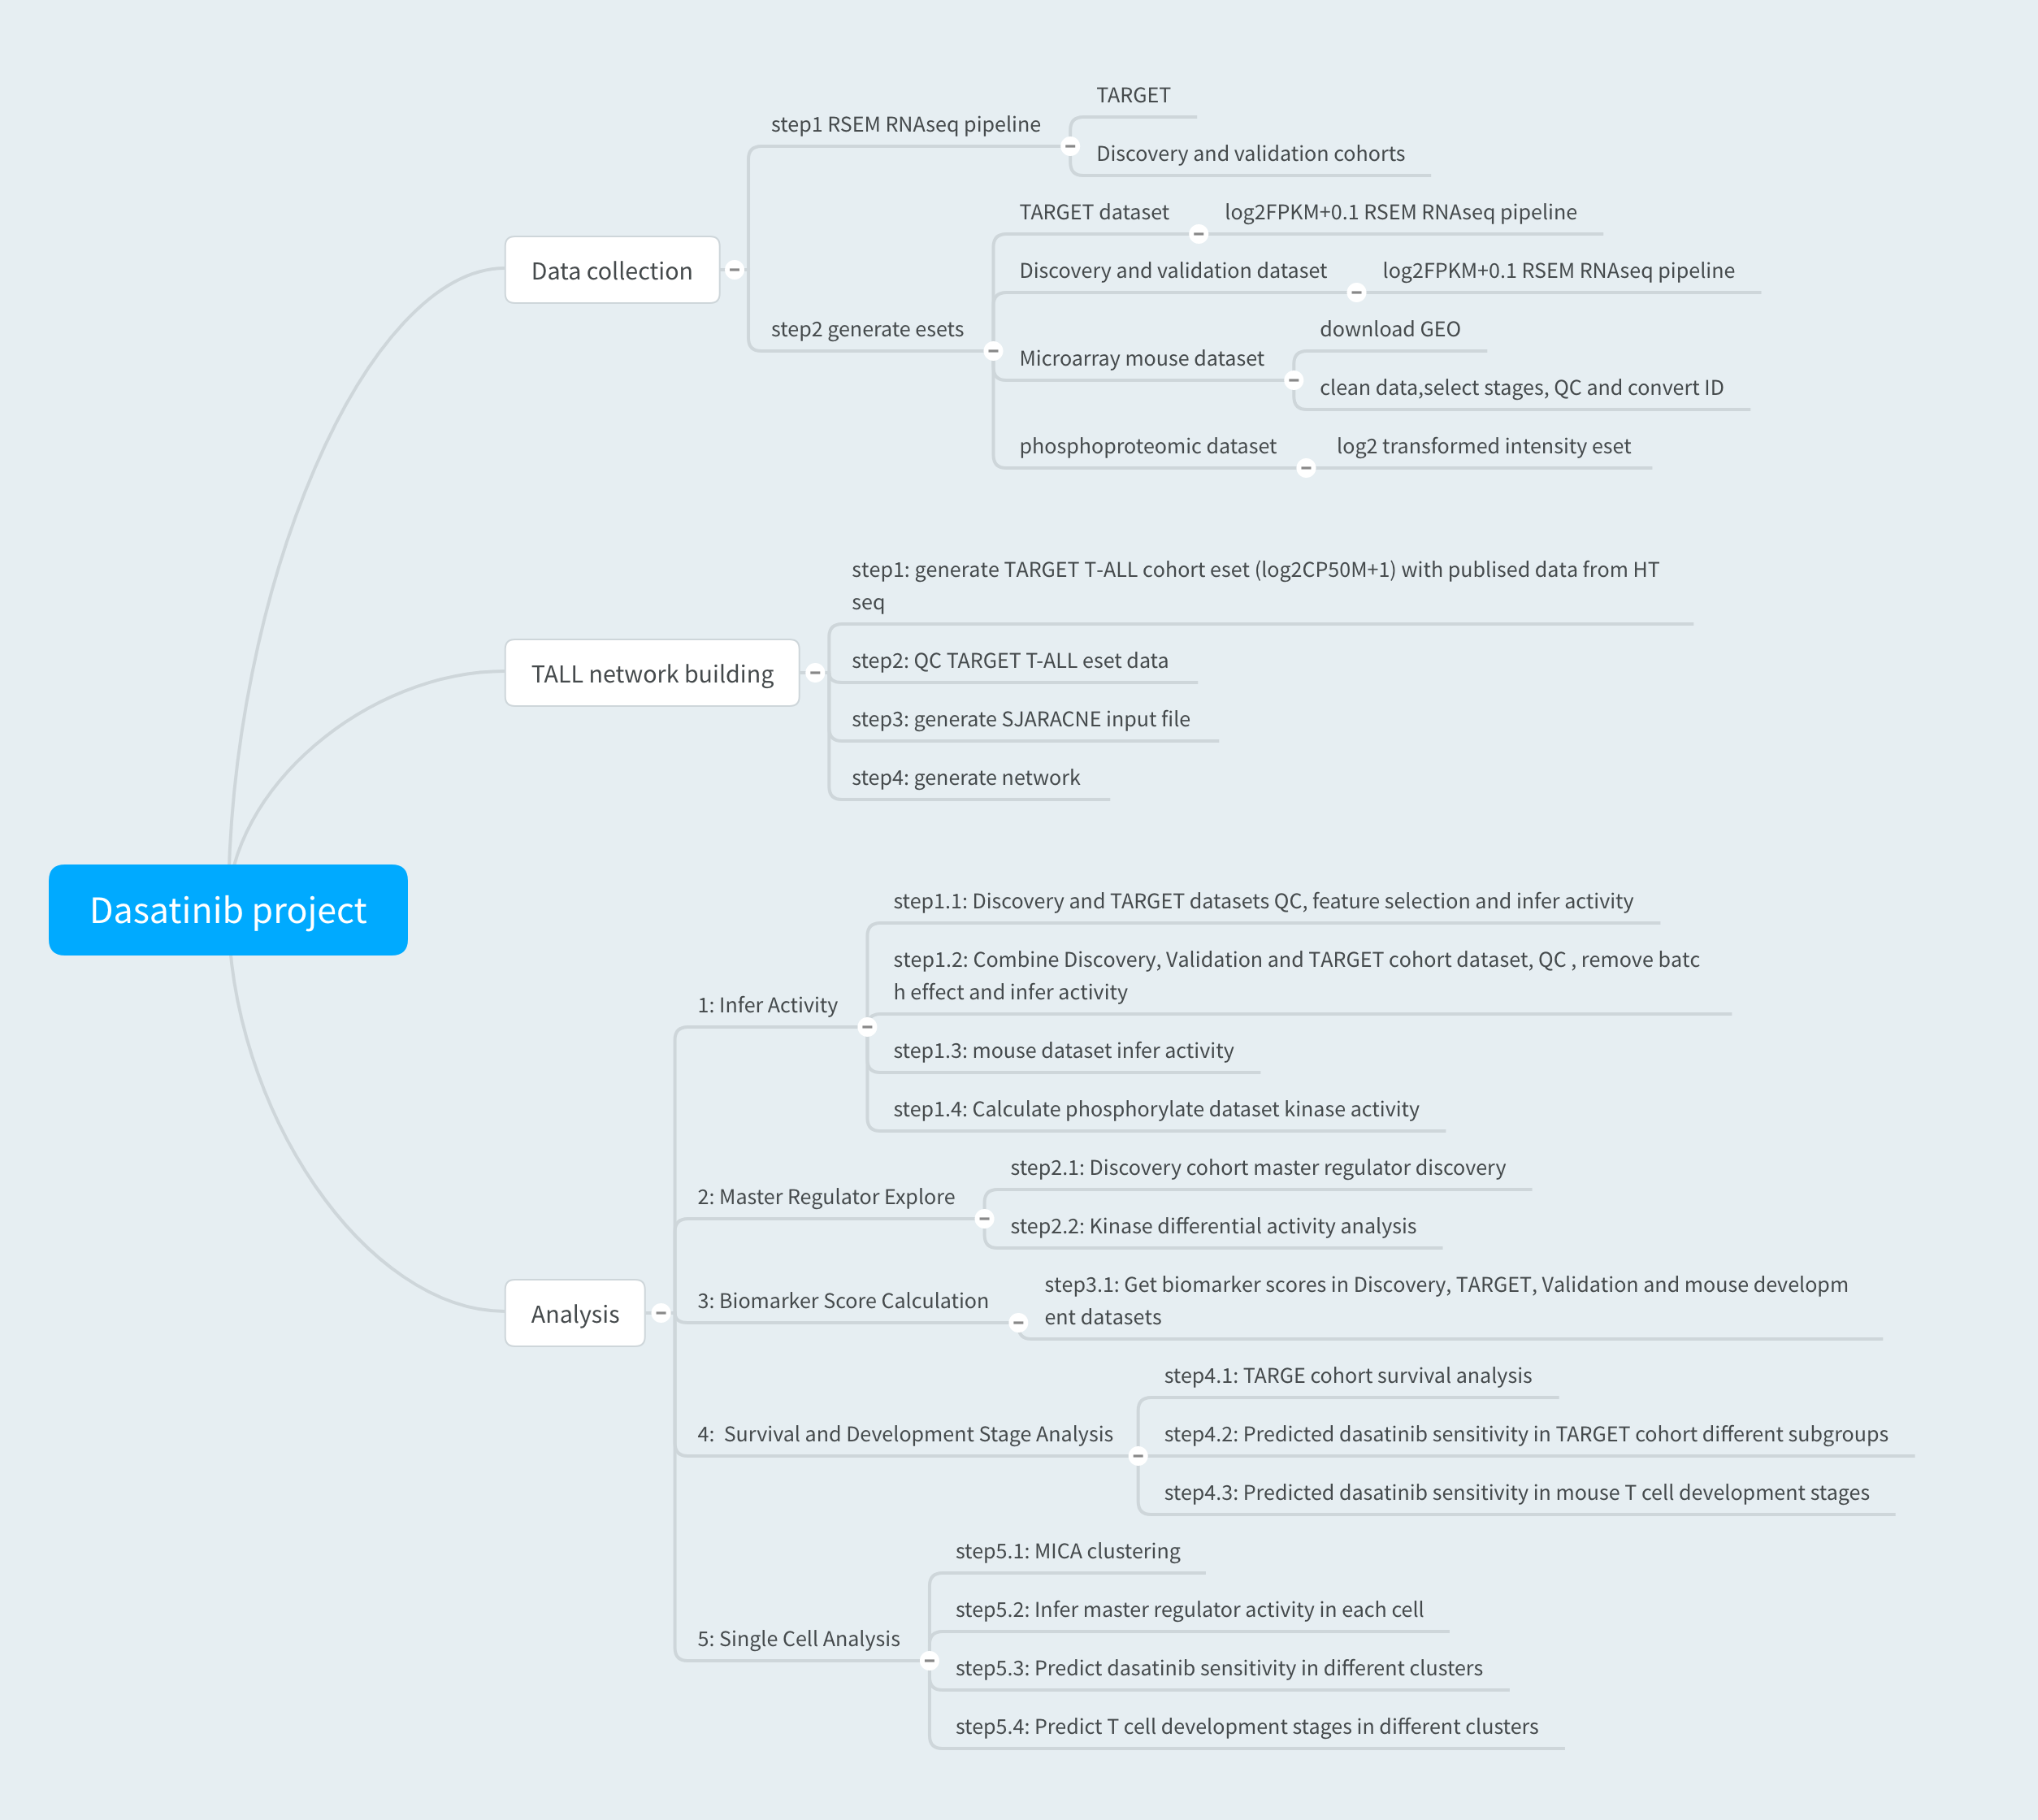
There are five major analysis steps included in this section: 1.Infer activity; 2.Driver exploring; 3.Biomarker score calculation; 4.Survival and Development stage analysis; 5.PDX scRNA-seq analysis.
-
Infer activity
-We inferred driver activity in Discovery, Validation, TARGET cohorts by T-ALL netowrk.
-After ID conversion, driver activity was calculated in mouse dataset by T-ALL network.
-We used human kinase-substrate data base to infer kinase activity in PDX phosphoproteomic data.- See scripts: 1.1.calculateActivity_Discovery.R, 1.2.calculateActivity_TARGET.R, 1.3.calculateActivity_combined.R, 1.4.calculateActivity_GSE15907.R and 1.5.calculateActivity_phospho.R
-
Driver exploring
-Drivers that affact Dasatinib sensitivity in T-ALL were explored in Discovery cohort.
-Kinases that changed activity after Dasatinib treatment in PDX samples were identified by using phosphoproteomic data.- See scripts: 2.1.masterTable_Discovery.R and 2.2.masterTable_phospho_kinaseAC.R
-
Biomarker score calculation
-Dasatinib sensitivity related drivers were selected by integrating knowledge based dasatinib targets, preTCR pathway genes and Network analysis based top driver genes.
-Selected sensitivity related driver activities were summarized into one dasatinib sensitivity biomarker score.
-Biomarker score were calculated in Discovery, Validationa and TAREGET cohorts.- See script: 3.1.get30biomarker_score.R
-
Survival and Development stage analysis -We found the biomarker score distributed differently among the T-ALL subgroups in TARGET cohort.
-We applied the Dasatinib sensitivity biomarker score cutoff from Discovery cohort to TARGET cohort to predict sensitive and resistant cases and found significant difference in event-free survival probability.
-Dasatinib sensitive and resistant cases showed different T cell development stage by clustering Discovery samples with mouse samples. -
scRNA-seq with PDX samples
-We applied MICA algorithm to cluster PDX cells treated with or without dasatinib.
-Driver activities were inferred by T-ALL network.
-Different development stages of each cluster was predicted by examining gene expression signatures of ETP or DN3/DN4 stages.