
If you like or use this project, please provide feedback to author - Star it ★ and write what's missing for you.
Overview of Monitoring Artist (dockerized) monitoring ecosystem:
- Zabbix XXL - standard Zabbix server/proxy/UI/snmpd/java gateway with additional XXL extensions
- Dockbix agent XXL - Zabbix agent with Docker (Kubernetes/Mesos/Chronos/Marathon) monitoring
- Zabbix templates - tiny (5MB) image for easy template deployment of selected Zabbix monitoring templates
- Zabbix extension - all templates - storage image for Zabbix XXL with 200+ community templates
- Kubernetized Zabbix - containerized Zabbix cluster based on Kubernetes
- Grafana XXL - dockerized Grafana with all community plugins
- Grafana dashboards - Grafana dashboard collection for AWS and Zabbix
- Monitoring Analytics - R statistical computing and graphics for monitoring from data scientists
- Docker killer - Docker image for Docker stress and Docker orchestration testing
Monitoring of Docker container by using Zabbix. Available CPU, mem, blkio, net container metrics and some containers config details e.g. IP, name, ... Zabbix Docker module has native support for Docker containers (Systemd included) and should support also a few other container type (e.g. LXC) out of the box. Please feel free to test and provide feedback/open issue. Module is focused on the performance, see section Module vs. UserParameter script.
Module is available also as a part of another project - Docker image dockbix-agent-xxl-limited (OS Linux host metrics are supported as well). Quick start:

docker run \
  --name=dockbix-agent-xxl \
  --net=host \
  --privileged \
  -v /:/rootfs \
  -v /var/run:/var/run \
  --restart unless-stopped \
  -e "ZA_Server=<ZABBIX SERVER IP/DNS NAME>" \
  -e "ZA_ServerActive=<ZABBIX SERVER IP/DNS NAME>" \
  -d monitoringartist/dockbix-agent-xxl-limited:latest
Visit Dockbix agent XXL with Docker monitoring for more informations.
Please donate to author, so he can continue to publish other awesome projects for free:

- Import provided template Zabbix-Template-App-Docker.xml.
- Configure your Zabbix agent(s) - load downloaded (see table below) or your
compiled
zabbix_module_docker.so
https://www.zabbix.com/documentation/3.0/manual/config/items/loadablemodules
Available templates:
- Zabbix-Template-App-Docker.xml - standard (recommended) template
- Zabbix-Template-App-Docker-active.xml - standard template with active checks
- Zabbix-Template-App-Docker-Mesos-Marathon-Chronos.xml - template for monitoring of Docker containers in Mesos cluster (Marathon/Chronos)
You can use Docker image monitoringartist/zabbix-templates for import of Zabbix-Template-App-Docker.xml template. For example:
docker run --rm \
  -e XXL_apiurl=http://zabbix.org/zabbix \
  -e XXL_apiuser=Admin \
  -e XXL_apipass=zabbix \
  monitoringartist/zabbix-templates
Download latest build of zabbix_module_docker.so for Zabbix 3.2/3.0 agents 
| OS | Docker module for Zabbix 3.2 | Docker module for Zabbix 3.0 |
|---|---|---|
| Amazon Linux | Download | Download |
| CentOS 7 | Download | Download |
| CentOS 6 | Download | Download |
| Debian 8 | Download | Download |
| Debian 7 | Download | Download |
| Fedora 25 | Download | Download |
| Fedora 24 | Download | Download |
| openSUSE 42 | Download | Download |
| openSUSE 13 | Download | Download |
| RHEL 7 | Download | Download |
| RHEL 6 | Download | Download |
| Ubuntu 16 | Download | Download |
| Ubuntu 14 | Download | Download |
If provided build doesn't work on your system, please see section [Compilation] (#compilation). Or you can check [folder dockerfiles] (https://github.com/monitorinartist/zabbix-docker-monitoring/tree/master/dockerfiles), where Dockerfiles for different OS/Zabbix versions can be customized.
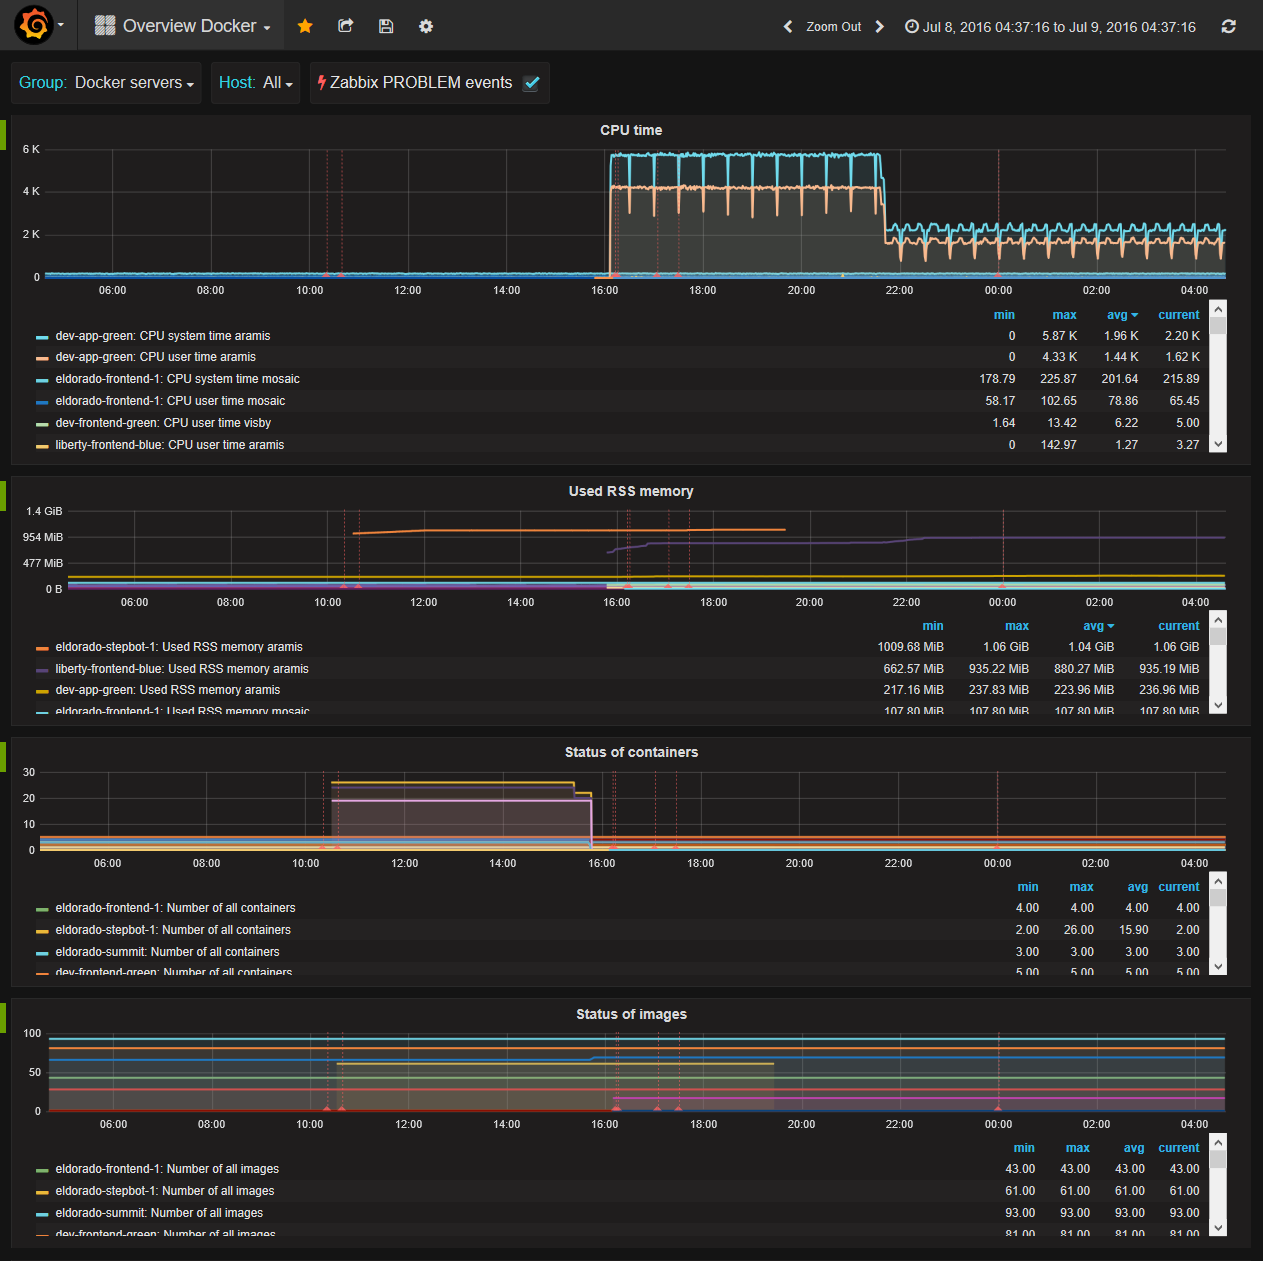
Custom Grafana dashboard for Docker monitoring with used Zabbix Docker (Mesos, Marathon/Chronos) templates is available in Grafana Zabbix dashboards repo.
Note: cid - container ID, two options are available:
- full container ID (macro {#FCONTAINERID}), e.g. 2599a1d88f75ea2de7283cbf469ea00f0e5d42aaace95f90ffff615c16e8fade
- human name or short container ID (macros {#HCONTAINERID} or {#SCONTAINERID}) - prefix "/" must be used, e.g. /zabbix-server or /2599a1d88f75
| Key | Description |
|---|---|
| docker.discovery[<par1>,<par2>,<par3>] | LLD discovering: Only running containers are discovered. Additional Docker permissions are needed, when you want to see container name (human name) in metrics/graphs instead of short container ID. Optional parameters are used for definition of HCONTAINERID - docker.inspect function will be used in this case. For example: docker.discovery[Config,Env,MESOS_TASK_ID=] is recommended for Mesos/Chronos/Marathon container monitoring Note 1: docker.discovery is faster version of docker.discovery[Name] Note 2: Available macros: {#FCONTAINERID} - full container ID (64 character string) {#SCONTAINERID} - short container ID (12 character string) {#HCONTAINERID} - human name of container {#SYSTEM.HOSTNAME} - system hostname |
| docker.mem[cid,mmetric] | Memory metrics: mmetric - any available memory metric in the pseudo-file memory.stat, e.g.: cache, rss, mapped_file, pgpgin, pgpgout, swap, pgfault, pgmajfault, inactive_anon, active_anon, inactive_file, active_file, unevictable, hierarchical_memory_limit, hierarchical_memsw_limit, total_cache, total_rss, total_mapped_file, total_pgpgin, total_pgpgout, total_swap, total_pgfault, total_pgmajfault, total_inactive_anon, total_active_anon, total_inactive_file, total_active_file, total_unevictable, Note: if you have problem with memory metrics, be sure that memory cgroup subsystem is enabled - kernel parameter: cgroup_enable=memory |
| docker.cpu[cid,cmetric] | CPU metrics: cmetric - any available CPU metric in the pseudo-file cpuacct.stat/cpu.stat, e.g.: system, user, total (current sum of system/user or container throttling metrics: nr_throttled, throttled_time Note: CPU user/system/total metrics must be recalculated to % utilization value by Zabbix - Delta (speed per second). |
| docker.dev[cid,bfile,bmetric] | Blk IO metrics: bfile - container blkio pseudo-file, e.g.: blkio.io_merged, blkio.io_queued, blkio.io_service_bytes, blkio.io_serviced, blkio.io_service_time, blkio.io_wait_time, blkio.sectors, blkio.time, blkio.avg_queue_size, blkio.idle_time, blkio.dequeue, ... bmetric - any available blkio metric in selected pseudo-file, e.g.: Total. Option for selected block device only is also available e.g. '8:0 Sync' (quotes must be used in key parameter in this case) Note: Some pseudo blkio files are available only if kernel config CONFIG_DEBUG_BLK_CGROUP=y, see recommended docs. |
| docker.inspect[cid,par1,<par2>,<par3>] | Docker inspection: Requested value from Docker inspect JSON object (e.g. API v1.21) is returned. par1 - name of 1st level JSON property par2 - optional name of 2nd level JSON property par3 - optional name of 3rd level JSON property or selector of item in the JSON array For example: docker.inspect[cid,Config,Image], docker.inspect[cid,NetworkSettings,IPAddress], docker.inspect[cid,Config,Env,MESOS_TASK_ID=], docker.inspect[cid,State,StartedAt], docker.inspect[cid,Name] Note 1: Requested value must be plain text/numeric value. JSON objects and booleans are not supported. Note 2: Additional Docker permissions are needed. Note 3: If you use selector for selecting value in array, then selector string is removed from returned value. |
| docker.info[info] | Docker information: Requested value from Docker info JSON object (e.g. API v1.21) is returned. info - name of requested information, e.g. Containers, Images, NCPU, ... Note: Additional Docker permissions are needed. |
| docker.stats[cid,par1,<par2>,<par3>] | Docker container resource usage statistics: Docker version 1.5+ is required Requested value from Docker stats JSON object (e.g. API v1.21) is returned. par1 - name of 1st level JSON property par2 - optional name of 2nd level JSON property par3 - optional name of 3rd level JSON property For example: docker.stats[cid,memory_stats,usage], docker.stats[cid,network,rx_bytes], docker.stats[cid,cpu_stats,cpu_usage,total_usage] Note 1: Requested value must be plain text/numeric value. JSON objects/arrays are not supported. Note 2: Additional Docker permissions are needed. Note 3: The most accurate way to get Docker container stats, but it's also the slowest (0.3-0.7s), because data are readed from on demand container stats stream. |
| docker.cstatus[status] | Count of Docker containers in defined status: status - container status, available statuses: All - count of all containers Up - count of running containers (Paused included) Exited - count of exited containers Crashed - count of crashed containers (exit code != 0) Paused - count of paused containers Note: Additional Docker permissions are needed. |
| docker.istatus[status] | Count of Docker images in defined status: status - image status, available statuses: All - all images Dangling - count of dangling images Note: Additional Docker permissions are needed. |
| docker.vstatus[status] | Count of Docker volumes in defined status: status - volume status, available statuses: All - all volumes Dangling - count of dangling volumes Note 1: Additional Docker permissions are needed. Note2: Docker API v1.21+ is required |
| docker.up[cid] | Running state check: 1 if container is running, otherwise 0 |
| docker.xnet[cid,interface,nmetric] | Network metrics (experimental): interface - name of interface, e.g. eth0, if name is all, then sum of selected metric across all interfaces is returned (lo included) nmetric - any available network metric name from output of command netstat -i: MTU, Met, RX-OK, RX-ERR, RX-DRP, RX-OVR, TX-OK, TX-ERR, TX-DRP, TX-OVR For example: docker.xnet[cid,eth0,TX-OK] docker.xnet[cid,all,RX-ERR] Note: Root permissions (AllowRoot=1) are required, because net namespaces (/var/run/netns/) are created/used |
Maybe in the future:
- systemd.net - net metrics of systemd units
- systemd.log - log monitoring of systemd units
- docker.cpu - collector implementation
[Standard Zabbix log monitoring] (https://www.zabbix.com/documentation/3.0/manual/config/items/itemtypes/log_items) can be used. Keep in mind, that Zabbix agent must support active mode for log monitoring. Stdout/stderr Docker container console output is logged by Docker into file /var/lib/docker/containers/<fid>/<fid>-json.log (fid - full container ID = macro {#FCONTAINERID}). If the application in container is not able to log to stdout/stderr, link log file to stdout/stderr. For example:
ln -sf /dev/stdout /var/log/nginx/access.log
ln -sf /dev/stderr /var/log/nginx/error.log
Example of -json log file:
{"log":"2015-07-03 00:15:05,870 DEBG fd 13 closed, stopped monitoring \u003cPOutputDispatcher at 37974528 for \u003cSubprocess at 37493936 with name php-fpm in state STARTING\u003e (stdout)\u003e\n","stream":"stdout","time":"2015-07-03T00:15:05.871956756Z"}
{"log":"2015-07-03 00:15:05,873 DEBG fd 17 closed, stopped monitoring \u003cPOutputDispatcher at 37974240 for \u003cSubprocess at 37493936 with name php-fpm in state STARTING\u003e (stderr)\u003e\n","stream":"stdout","time":"2015-07-03T00:15:05.875886957Z"}
{"log":"2015-07-03 00:15:06,878 INFO success: nginx entered RUNNING state, process has stayed up for \u003e than 1 seconds (startsecs)\n","stream":"stdout","time":"2015-07-03T00:15:06.882435459Z"}
{"log":"2015-07-03 00:15:06,879 INFO success: nginx-reload entered RUNNING state, process has stayed up for \u003e than 1 seconds (startsecs)\n","stream":"stdout","time":"2015-07-03T00:15:06.882548486Z"}
Recommended Zabbix log key for this case:
log[/var/lib/docker/containers/<fid>/<fid>-json.log,"\"log\":\"(.*)\",\"stream",,,skip,\1]
You can utilize Zabbix LLD for automatic Docker container log monitoring. In this case it'll be:
log[/var/lib/docker/containers/{#FCONTAINERID}/{#FCONTAINERID}-json.log,"\"log\":\"(.*)\",\"stream",,,skip,\1]
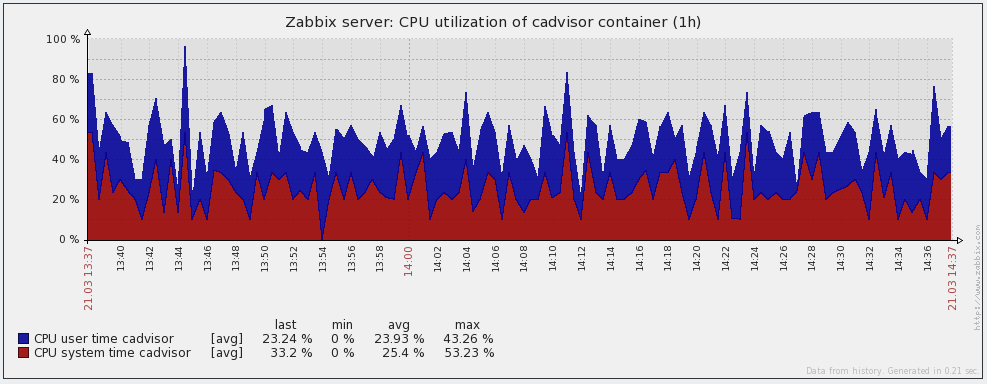
Docker container CPU graph in Zabbix:
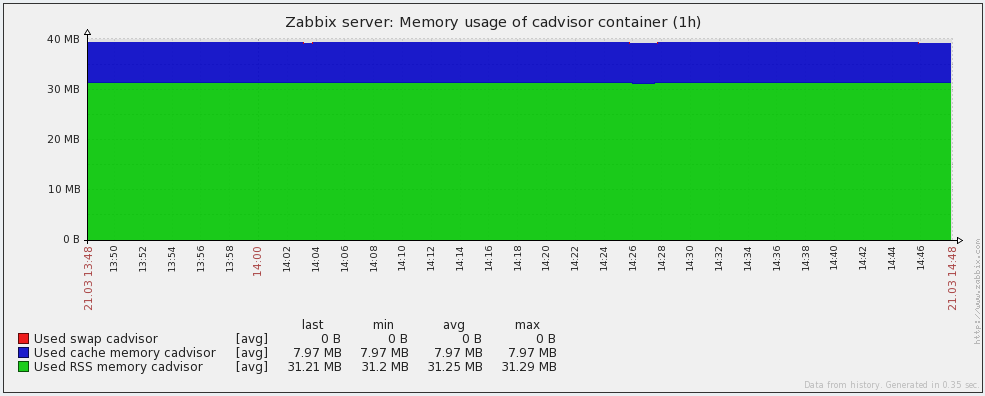
 Docker container memory graph in Zabbix:
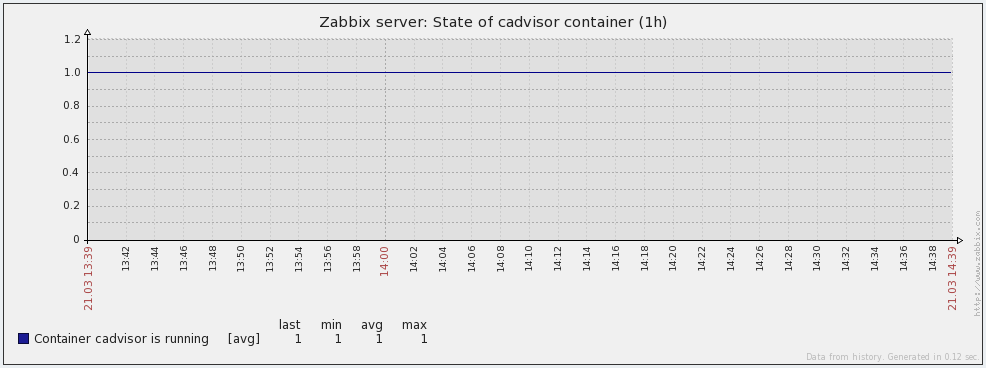
 Docker container state graph in Zabbix:
You have two options, how to get additional Docker permissions:
- Add zabbix user to docker group (recommended option):
usermod -aG docker zabbix
Or
- Edit zabbix_agentd.conf and set AllowRoot (Zabbix agent with root permissions):
AllowRoot=1
Note: If you use Docker from RHEL/Centos repositories, then you have to use AllowRoot=1 option.
If you are on a system that have SELinux in enforcing-mode (check with getenforce), you can make it work with this SELinux module. This module will persist reboots.
module zabbix-docker 1.1;

require {
        type docker_var_run_t;
        type unreserved_port_t;
        type zabbix_agent_t;
        type docker_t;
        type cgroup_t;
        type modules_object_t;
        class sock_file write;
        class unix_stream_socket connectto;
        class capability dac_override;
        class tcp_socket name_connect;
        class file { ioctl read getattr lock open execute };
        class dir { ioctl read getattr lock add_name reparent search open };
}

#============= zabbix_agent_t ==============

allow zabbix_agent_t docker_t:unix_stream_socket connectto;
allow zabbix_agent_t docker_var_run_t:sock_file write;
allow zabbix_agent_t self:capability dac_override;
allow zabbix_agent_t unreserved_port_t:tcp_socket name_connect;
allow zabbix_agent_t cgroup_t:file { ioctl read getattr lock open };
allow zabbix_agent_t cgroup_t:dir { ioctl read getattr lock search open };
allow zabbix_agent_t modules_object_t:file { read open execute };
Save it, the run:
checkmodule -M -m -o zabbix-docker.mod zabbix-docker.te
semodule_package -o zabbix-docker.pp -m zabbix-docker.mod
semodule -i zabbix-docker.pp
You have to compile module, if provided binary doesn't work on your system. Basic compilation steps (please use right Zabbix branch version):
# Required CentOS/RHEL packages:   yum install -y wget autoconf automake gcc svn
# Required Debian/Ubuntu packages: apt-get install -y wget autoconf automake gcc subversion make pkg-config
# Required Fedora packages:        dnf install -y wget autoconf automake gcc subversion make
# Required openSUSE packages:      zypper install -y wget autoconf automake gcc subversion make pkg-config
cd ~
svn export svn://svn.zabbix.com/branches/3.2 zabbix
cd zabbix
./bootstrap.sh
./configure --enable-agent
mkdir src/modules/zabbix_module_docker
cd src/modules/zabbix_module_docker
wget https://raw.githubusercontent.com/monitoringartist/zabbix-docker-monitoring/master/src/modules/zabbix_module_docker/zabbix_module_docker.c
wget https://raw.githubusercontent.com/monitoringartist/zabbix-docker-monitoring/master/src/modules/zabbix_module_docker/Makefile
make
Output will be binary file (dynamically linked shared object library) zabbix_module_docker.so, which can be loaded by Zabbix agent.
You can use also Docker for compilation. Example of Dockerfiles, which have been prepared for module compilation - https://github.com/monitoringartist/zabbix-docker-monitoring/tree/master/dockerfiles
See https://blog.docker.com/2013/10/gathering-lxc-docker-containers-metrics/ Metrics for containers are read from cgroup file system. Docker API is used for discovering and some keys. However root or docker permissions are required for communication with Docker via unix socket. You can test API also in your command line:
echo -e "GET /containers/json?all=0 HTTP/1.0\r\n" | nc -U /var/run/docker.sock
Module is ~10x quicker, because it's compiled binary code. I've used my project [Zabbix agent stress test] (https://github.com/monitoringartist/zabbix-agent-stress-test) for performance tests.
Part of config in zabbix_agentd.conf:
UserParameter=xdocker.cpu[*],grep $2 /cgroup/cpuacct/docker/$1/cpuacct.stat | awk '{print $$2}'
LoadModule=zabbix_module_docker.so
Tests:
[root@dev zabbix-agent-stress-test]# ./zabbix-agent-stress-test.py -s 127.0.0.1 -k "xdocker.cpu[d5bf68ec1fb570d8ac3047226397edd8618eed14278ce035c98fbceef02d7730,system]" -t 20
Warning: you are starting more threads, than your system has available CPU cores (4)!
Starting 20 threads, host: 127.0.0.1:10050, key: xdocker.cpu[d5bf68ec1fb570d8ac3047226397edd8618eed14278ce035c98fbceef02d7730,system]
Success: 291    Errors: 0       Avg speed: 279.68 qps   Execution time: 1.00 sec
Success: 548    Errors: 0       Avg speed: 349.04 qps   Execution time: 2.00 sec
Success: 803    Errors: 0       Avg speed: 282.72 qps   Execution time: 3.00 sec
Success: 1060   Errors: 0       Avg speed: 209.31 qps   Execution time: 4.00 sec
Success: 1310   Errors: 0       Avg speed: 187.14 qps   Execution time: 5.00 sec
Success: 1570   Errors: 0       Avg speed: 178.80 qps   Execution time: 6.01 sec
Success: 1838   Errors: 0       Avg speed: 189.36 qps   Execution time: 7.01 sec
Success: 2106   Errors: 0       Avg speed: 225.68 qps   Execution time: 8.01 sec
Success: 2382   Errors: 0       Avg speed: 344.51 qps   Execution time: 9.01 sec
Success: 2638   Errors: 0       Avg speed: 327.88 qps   Execution time: 10.01 sec
Success: 2905   Errors: 0       Avg speed: 349.93 qps   Execution time: 11.01 sec
Success: 3181   Errors: 0       Avg speed: 352.23 qps   Execution time: 12.01 sec
Success: 3450   Errors: 0       Avg speed: 239.38 qps   Execution time: 13.01 sec
Success: 3678   Errors: 0       Avg speed: 209.88 qps   Execution time: 14.02 sec
Success: 3923   Errors: 0       Avg speed: 180.30 qps   Execution time: 15.02 sec
Success: 4178   Errors: 0       Avg speed: 201.58 qps   Execution time: 16.02 sec
Success: 4434   Errors: 0       Avg speed: 191.92 qps   Execution time: 17.02 sec
Success: 4696   Errors: 0       Avg speed: 332.06 qps   Execution time: 18.02 sec
Success: 4968   Errors: 0       Avg speed: 325.55 qps   Execution time: 19.02 sec
Success: 5237   Errors: 0       Avg speed: 325.61 qps   Execution time: 20.02 sec
^C
Success: 5358   Errors: 0       Avg rate: 192.56 qps    Execution time: 20.53 sec
Avg rate based on total execution time and success connections: 261.02 qps

[root@dev zabbix-agent-stress-test]# ./zabbix-agent-stress-test.py -s 127.0.0.1 -k "docker.cpu[d5bf68ec1fb570d8ac3047226397edd8618eed14278ce035c98fbceef02d7730,system]" -t 20
Warning: you are starting more threads, than your system has available CPU cores (4)!
Starting 20 threads, host: 127.0.0.1:10050, key: docker.cpu[d5bf68ec1fb570d8ac3047226397edd8618eed14278ce035c98fbceef02d7730,system]
Success: 2828   Errors: 0       Avg speed: 2943.98 qps  Execution time: 1.00 sec
Success: 5095   Errors: 0       Avg speed: 1975.77 qps  Execution time: 2.01 sec
Success: 7623   Errors: 0       Avg speed: 2574.55 qps  Execution time: 3.01 sec
Success: 10098  Errors: 0       Avg speed: 4720.20 qps  Execution time: 4.02 sec
Success: 12566  Errors: 0       Avg speed: 3423.56 qps  Execution time: 5.02 sec
Success: 14706  Errors: 0       Avg speed: 2397.01 qps  Execution time: 6.03 sec
Success: 17128  Errors: 0       Avg speed: 903.63 qps   Execution time: 7.05 sec
Success: 19520  Errors: 0       Avg speed: 2663.53 qps  Execution time: 8.05 sec
Success: 21899  Errors: 0       Avg speed: 1516.36 qps  Execution time: 9.07 sec
Success: 24219  Errors: 0       Avg speed: 3570.47 qps  Execution time: 10.07 sec
Success: 26676  Errors: 0       Avg speed: 1204.58 qps  Execution time: 11.08 sec
Success: 29162  Errors: 0       Avg speed: 2719.87 qps  Execution time: 12.08 sec
Success: 31671  Errors: 0       Avg speed: 2265.67 qps  Execution time: 13.08 sec
Success: 34186  Errors: 0       Avg speed: 3490.64 qps  Execution time: 14.08 sec
Success: 36749  Errors: 0       Avg speed: 2094.59 qps  Execution time: 15.09 sec
Success: 39047  Errors: 0       Avg speed: 3213.35 qps  Execution time: 16.09 sec
Success: 41361  Errors: 0       Avg speed: 3171.67 qps  Execution time: 17.09 sec
Success: 43739  Errors: 0       Avg speed: 3946.53 qps  Execution time: 18.09 sec
Success: 46100  Errors: 0       Avg speed: 1308.88 qps  Execution time: 19.09 sec
Success: 48556  Errors: 0       Avg speed: 2663.52 qps  Execution time: 20.09 sec
^C
Success: 49684  Errors: 0       Avg rate: 2673.85 qps   Execution time: 20.52 sec
Avg rate based on total execution time and success connections: 2420.70 qps
Results of 20s stress test:
| StartAgent value | Module qps | UserParameter script qps |
|---|---|---|
| 3 | 2420.70 | 261.02 |
| 10 | 2612.20 | 332.62 |
| 20 | 2487.93 | 348.52 |
Discovery test:
Part of config in zabbix_agentd.conf:
UserParameter=xdocker.discovery,/etc/zabbix/scripts/container_discover.sh
LoadModule=zabbix_module_docker.so
[container_discover.sh] (https://github.com/bsmile/zabbix-docker-lld/blob/master/usr/lib/zabbix/script/container_discover.sh):
Test with 237 running containers:
[root@dev ~]# docker info
Containers: 237
Images: 121
Storage Driver: btrfs
Execution Driver: native-0.2
Kernel Version: 3.10.0-229.el7.x86_64
Operating System: Red Hat Enterprise Linux Server 7.1 (Maipo)
CPUs: 10
Total Memory: 62.76 GiB
Name: dev.local
ID: AOAM:BO3G:5MCE:5FMM:IWKP:NPM4:PRKV:ZZ34:BYFL:XGAV:SRNJ:LKDH
Username: username
Registry: [https://index.docker.io/v1/]
[root@dev ~]# time zabbix_get -s 127.0.0.1 -k docker.discovery > /dev/null

real    0m0.112s
user    0m0.000s
sys     0m0.003s
[root@dev ~]# time zabbix_get -s 127.0.0.1 -k xdocker.discovery > /dev/null

real    0m5.856s
user    0m0.000s
sys     0m0.002s
[root@dev ~]# ./zabbix-agent-stress-test.py -s 127.0.0.1 -k xdocker.discovery
Starting 1 threads, host: 127.0.0.1:10050, key: xdocker.discovery
Success: 0      Errors: 0       Avg rate: 0.00 qps      Execution time: 1.00 sec
Success: 0      Errors: 0       Avg rate: 0.00 qps      Execution time: 2.00 sec
Success: 0      Errors: 0       Avg rate: 0.00 qps      Execution time: 3.02 sec
Success: 0      Errors: 0       Avg rate: 0.00 qps      Execution time: 4.02 sec
Success: 0      Errors: 0       Avg rate: 0.00 qps      Execution time: 5.02 sec
Success: 1      Errors: 0       Avg rate: 0.10 qps      Execution time: 6.02 sec
Success: 1      Errors: 0       Avg rate: 0.10 qps      Execution time: 7.02 sec
Success: 1      Errors: 0       Avg rate: 0.10 qps      Execution time: 8.02 sec
Success: 1      Errors: 0       Avg rate: 0.10 qps      Execution time: 9.02 sec
Success: 1      Errors: 0       Avg rate: 0.10 qps      Execution time: 10.02 sec
Success: 2      Errors: 0       Avg rate: 0.14 qps      Execution time: 11.02 sec
Success: 2      Errors: 0       Avg rate: 0.14 qps      Execution time: 12.03 sec
Success: 2      Errors: 0       Avg rate: 0.14 qps      Execution time: 13.03 sec
Success: 2      Errors: 0       Avg rate: 0.14 qps      Execution time: 14.03 sec
Success: 2      Errors: 0       Avg rate: 0.14 qps      Execution time: 15.03 sec
Success: 3      Errors: 0       Avg rate: 0.16 qps      Execution time: 16.03 sec
Success: 3      Errors: 0       Avg rate: 0.16 qps      Execution time: 17.03 sec
Success: 3      Errors: 0       Avg rate: 0.16 qps      Execution time: 18.03 sec
Success: 3      Errors: 0       Avg rate: 0.16 qps      Execution time: 19.03 sec
Success: 3      Errors: 0       Avg rate: 0.16 qps      Execution time: 20.03 sec
Success: 3      Errors: 0       Avg rate: 0.16 qps      Execution time: 21.04 sec
Success: 4      Errors: 0       Avg rate: 0.17 qps      Execution time: 22.04 sec
Success: 4      Errors: 0       Avg rate: 0.17 qps      Execution time: 23.04 sec
Success: 4      Errors: 0       Avg rate: 0.17 qps      Execution time: 24.04 sec
Success: 4      Errors: 0       Avg rate: 0.17 qps      Execution time: 25.05 sec
Success: 5      Errors: 0       Avg rate: 0.20 qps      Execution time: 26.05 sec
Success: 5      Errors: 0       Avg rate: 0.20 qps      Execution time: 27.05 sec
Success: 5      Errors: 0       Avg rate: 0.20 qps      Execution time: 28.05 sec
Success: 5      Errors: 0       Avg rate: 0.20 qps      Execution time: 29.05 sec
Success: 5      Errors: 0       Avg rate: 0.20 qps      Execution time: 30.05 sec
Success: 5      Errors: 0       Avg rate: 0.20 qps      Execution time: 31.05 sec
^C
Success: 5      Errors: 0       Avg rate: 0.20 qps      Execution time: 31.35 sec
Avg rate based on total execution time and success connections: 0.16 qps
[root@dev ~]# ./zabbix-agent-stress-test.py -s 127.0.0.1 -k docker.discovery
Starting 1 threads, host: 127.0.0.1:10050, key: docker.discovery
Success: 5      Errors: 0       Avg rate: 6.26 qps      Execution time: 1.00 sec
Success: 5      Errors: 0       Avg rate: 6.26 qps      Execution time: 2.00 sec
Success: 12     Errors: 0       Avg rate: 7.45 qps      Execution time: 3.00 sec
Success: 20     Errors: 0       Avg rate: 6.77 qps      Execution time: 4.00 sec
Success: 28     Errors: 0       Avg rate: 7.82 qps      Execution time: 5.00 sec
Success: 36     Errors: 0       Avg rate: 7.21 qps      Execution time: 6.01 sec
Success: 43     Errors: 0       Avg rate: 10.22 qps     Execution time: 7.01 sec
Success: 43     Errors: 0       Avg rate: 10.22 qps     Execution time: 8.01 sec
Success: 50     Errors: 0       Avg rate: 6.79 qps      Execution time: 9.01 sec
Success: 57     Errors: 0       Avg rate: 6.11 qps      Execution time: 10.01 sec
Success: 66     Errors: 0       Avg rate: 8.50 qps      Execution time: 11.01 sec
Success: 73     Errors: 0       Avg rate: 6.51 qps      Execution time: 12.01 sec
Success: 81     Errors: 0       Avg rate: 7.18 qps      Execution time: 13.01 sec
Success: 82     Errors: 0       Avg rate: 7.85 qps      Execution time: 14.01 sec
Success: 87     Errors: 0       Avg rate: 6.54 qps      Execution time: 15.02 sec
Success: 95     Errors: 0       Avg rate: 7.84 qps      Execution time: 16.02 sec
Success: 103    Errors: 0       Avg rate: 9.24 qps      Execution time: 17.02 sec
Success: 111    Errors: 0       Avg rate: 9.94 qps      Execution time: 18.02 sec
Success: 119    Errors: 0       Avg rate: 7.63 qps      Execution time: 19.02 sec
Success: 120    Errors: 0       Avg rate: 6.70 qps      Execution time: 20.12 sec
Success: 121    Errors: 0       Avg rate: 3.61 qps      Execution time: 21.12 sec
Success: 128    Errors: 0       Avg rate: 8.46 qps      Execution time: 22.12 sec
Success: 136    Errors: 0       Avg rate: 7.63 qps      Execution time: 23.12 sec
Success: 144    Errors: 0       Avg rate: 6.21 qps      Execution time: 24.12 sec
Success: 150    Errors: 0       Avg rate: 6.89 qps      Execution time: 25.12 sec
Success: 157    Errors: 0       Avg rate: 10.87 qps     Execution time: 26.18 sec
Success: 160    Errors: 0       Avg rate: 7.52 qps      Execution time: 27.18 sec
Success: 168    Errors: 0       Avg rate: 9.81 qps      Execution time: 28.18 sec
Success: 174    Errors: 0       Avg rate: 6.69 qps      Execution time: 29.18 sec
Success: 181    Errors: 0       Avg rate: 6.35 qps      Execution time: 30.18 sec
Success: 188    Errors: 0       Avg rate: 7.64 qps      Execution time: 31.19 sec
^C
Success: 193    Errors: 0       Avg rate: 8.83 qps      Execution time: 31.79 sec
Avg rate based on total execution time and success connections: 6.07 qps
Edit your zabbix_agentd.conf and set DebugLevel:
DebugLevel=4
Module debug messages will be available in standard zabbix_agentd.log.
Please use Github issue tracker.
- https://docs.docker.com/engine/admin/runmetrics/
- https://www.kernel.org/doc/Documentation/cgroup-v1/blkio-controller.txt
- https://www.kernel.org/doc/Documentation/cgroup-v1/memory.txt
- https://www.kernel.org/doc/Documentation/cgroup-v1/cpuacct.txt
- https://access.redhat.com/documentation/en-US/Red_Hat_Enterprise_Linux/6/html/Resource_Management_Guide/index.html
Devops Monitoring Expert, who loves monitoring systems and cutting/bleeding edge technologies: Docker, Kubernetes, ECS, AWS, Google GCP, Terraform, Lambda, Zabbix, Grafana, Elasticsearch, Kibana, Prometheus, Sysdig, ...
Summary:
- 1000+ GitHub stars
- 6000+ Grafana dashboard downloads
- 800 000+ Docker image pulls
Professional devops / monitoring / consulting services: