WaterDrop Monitoring and Logging
Important
GitHub Wiki is just a mirror of our online documentation.
We highly recommend using our website docs due to Github Wiki limitations. Only some illustrations, links, screencasts, and code examples will work here, and the formatting may be broken.
Please use https://karafka.io/docs.
Each of the producers after the #setup is done, has a custom monitor to which you can subscribe.
producer = WaterDrop::Producer.new

producer.setup do |config|
  config.kafka = { 'bootstrap.servers': 'localhost:9092' }
end

producer.monitor.subscribe('message.produced_async') do |event|
  puts "A message was produced to '#{event[:message][:topic]}' topic!"
end

producer.produce_async(topic: 'events', payload: 'data')

producer.close
!!! info ""
See the `WaterDrop::Instrumentation::Notifications::EVENTS` for the list of all the supported events.
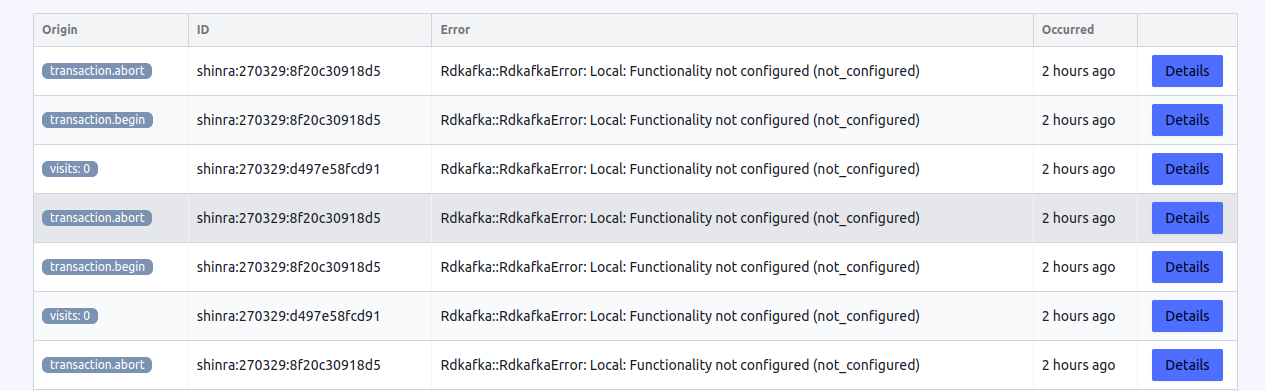
Karafka Web UI is a user interface for the Karafka framework. The Web UI provides a convenient way for monitor all producers related errors out of the box.
WaterDrop comes equipped with a LoggerListener, a useful feature designed to facilitate the reporting of WaterDrop's operational details directly into the assigned logger. The LoggerListener provides a convenient way of tracking the events and operations that occur during the usage of WaterDrop, enhancing transparency and making debugging and issue tracking easier.
However, it's important to note that this Logger Listener is not subscribed by default. This means that WaterDrop does not automatically send operation data to your logger out of the box. This design choice has been made to give users greater flexibility and control over their logging configuration.
To use this functionality, you need to manually subscribe the LoggerListener to WaterDrop instrumentation. Below, you will find an example demonstrating how to perform this subscription.
LOGGER = Logger.new($stdout)

producer = WaterDrop::Producer.new do |config|
  config.kafka = { 'bootstrap.servers': 'localhost:9092' }
  config.logger = LOGGER
end

producer.monitor.subscribe(
  WaterDrop::Instrumentation::LoggerListener.new(
    # You can use a different logger than the one assigned to WaterDrop if you want
    producer.config.logger,
    # If this is set to false, the produced messages details will not be sent to logs
    # You may set it to false if you find the level of reporting in the debug too extensive
    log_messages: true
  )
)

producer.produce_sync(topic: 'my.topic', payload: 'my.message')WaterDrop is configured to emit internal librdkafka metrics every five seconds. You can change this by setting the kafka statistics.interval.ms configuration property to a value greater of equal 0. Emitted statistics are available after subscribing to the statistics.emitted publisher event. If set to 0, metrics will not be published.
The statistics include all of the metrics from librdkafka (complete list here) as well as the diff of those against the previously emitted values.
!!! note ""
In the WaterDrop statistics metrics, specific measurements are denoted in milliseconds, while others are in microseconds. It's imperative to distinguish between these scales, as mistaking one for the other can lead to significant misinterpretations. Always ensure you're referencing the correct unit for each metric to maintain accuracy in your data analysis.
For several attributes like txmsgs, librdkafka publishes only the totals. In order to make it easier to track the progress (for example number of messages sent between statistics emitted events), WaterDrop diffs all the numeric values against previously available numbers. All of those metrics are available under the same key as the metric but with additional _d postfix:
producer = WaterDrop::Producer.new do |config|
  config.kafka = {
    'bootstrap.servers': 'localhost:9092',
    'statistics.interval.ms': 2_000 # emit statistics every 2 seconds
  }
end

producer.monitor.subscribe('statistics.emitted') do |event|
  sum = event[:statistics]['txmsgs']
  diff = event[:statistics]['txmsgs_d']

  p "Sent messages: #{sum}"
  p "Messages sent from last statistics report: #{diff}"
end

sleep(2)

# Sent messages: 0
# Messages sent from last statistics report: 0

20.times { producer.produce_async(topic: 'events', payload: 'data') }

# Sent messages: 20
# Messages sent from last statistics report: 20

sleep(2)

20.times { producer.produce_async(topic: 'events', payload: 'data') }

# Sent messages: 40
# Messages sent from last statistics report: 20

sleep(2)

# Sent messages: 40
# Messages sent from last statistics report: 0

producer.close
!!! note ""
The metrics returned may not be completely consistent between brokers, toppars and totals, due to the internal asynchronous nature of librdkafka. E.g., the top level tx total may be less than the sum of the broker tx values which it represents.
WaterDrop allows you to listen to all errors that occur while producing messages and in its internal background threads. Things like reconnecting to Kafka upon network errors and others unrelated to publishing messages are all available under error.occurred notification key. You can subscribe to this event to ensure your setup is healthy and without any problems that would otherwise go unnoticed as long as messages are delivered.
producer = WaterDrop::Producer.new do |config|
  config.kafka = {
    # Note invalid connection port...
    'bootstrap.servers': 'localhost:9090',
    # Make waterdrop give up on delivery after 100ms
    'message.timeout.ms': 100
  }
end

producer.monitor.subscribe('error.occurred') do |event|
  error = event[:error]

  p "WaterDrop error occurred: #{error}"
end

# Run this code without Kafka cluster
loop do
  producer.produce_async(topic: 'events', payload: 'data')

  sleep(1)
end

# After you stop your Kafka cluster, you will see a lot of those:
#
# WaterDrop error occurred: Local: Broker transport failure (transport)
#
# WaterDrop error occurred: Local: Broker transport failure (transport)
!!! note ""
`error.occurred` will also include any errors originating from `librdkafka` for synchronous operations, including those that are raised back to the end user.
!!! note ""
The `error.occurred` will **not** publish purge errors originating from transactions. Such occurrences are standard behavior during an aborted transaction and should not be classified as errors. For a deeper understanding, please consult the [transactions](https://karafka.io/docs/WaterDrop-Transactions) documentation.
WaterDrop allows you to listen to Kafka messages' acknowledgment events. This will enable you to monitor deliveries of messages from WaterDrop even when using asynchronous dispatch methods.
That way, you can make sure, that dispatched messages are acknowledged by Kafka.
producer = WaterDrop::Producer.new do |config|
  config.kafka = { 'bootstrap.servers': 'localhost:9092' }
end

producer.monitor.subscribe('message.acknowledged') do |event|
  producer_id = event[:producer_id]
  offset = event[:offset]

  p "WaterDrop [#{producer_id}] delivered message with offset: #{offset}"
end

loop do
  producer.produce_async(topic: 'events', payload: 'data')

  sleep(1)
end

# WaterDrop [dd8236fff672] delivered message with offset: 32
# WaterDrop [dd8236fff672] delivered message with offset: 33
# WaterDrop [dd8236fff672] delivered message with offset: 34Tracking the progress and status of each message may be crucial when producing messages with WaterDrop. There are instances where you'll need to monitor the delivery handle and report and relate them to the specific message that was dispatched. WaterDrop addresses this need with its labeling API. You can read about it in a dedicated Labeling API section.
WaterDrop comes with (optional) full Datadog and StatsD integration that you can use. To use it:
# require datadog/statsd and the listener as it is not loaded by default
require 'datadog/statsd'
require 'waterdrop/instrumentation/vendors/datadog/metrics_listener'

# initialize your producer with statistics.interval.ms enabled so the metrics are published
producer = WaterDrop::Producer.new do |config|
  config.deliver = true
  config.kafka = {
    'bootstrap.servers': 'localhost:9092',
    'statistics.interval.ms': 1_000
  }
end

# initialize the listener with statsd client
listener = ::WaterDrop::Instrumentation::Vendors::Datadog::MetricsListener.new do |config|
  config.client = Datadog::Statsd.new('localhost', 8125)
  # Publish host as a tag alongside the rest of tags
  config.default_tags = ["host:#{Socket.gethostname}"]
end

# Subscribe with your listener to your producer and you should be ready to go!
producer.monitor.subscribe(listener)
You can also find here a ready to import DataDog dashboard configuration file that you can use to monitor all of your producers.
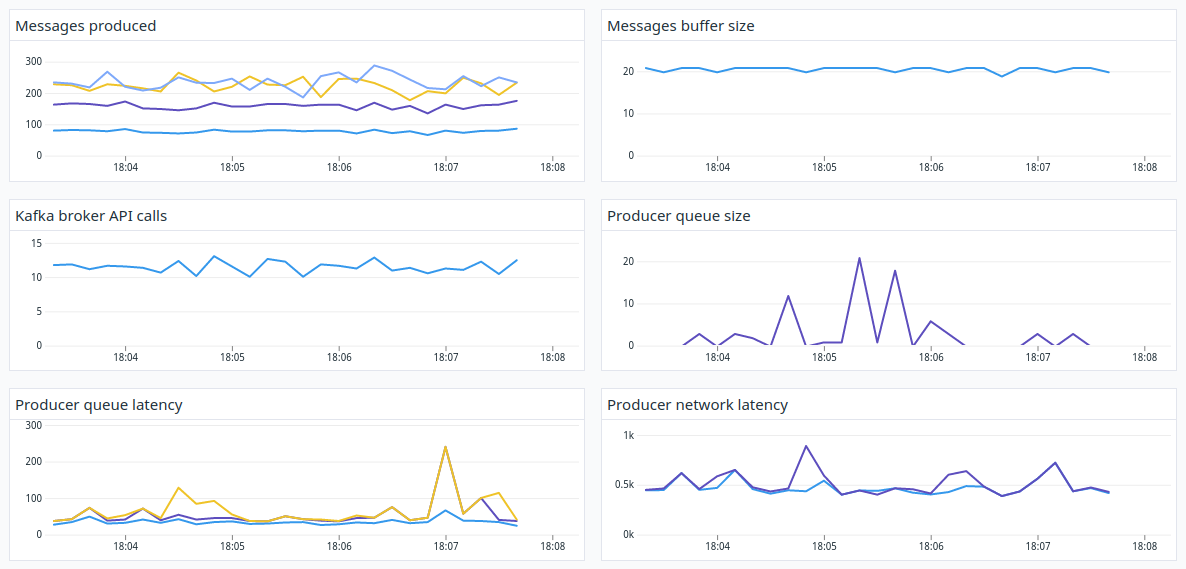
The WaterDrop Datadog listener provides a default set of metrics for reporting, but it does not cover every possible metric you might need. Fortunately, you can configure the listener to report additional metrics by enhancing its capabilities. There are two main methods to achieve this:
-
Notification Hook Enhanced Reporting: This method allows you to add extra instrumentation by subscribing to any events WaterDrop publishes via its notification bus. For example, if you want to count the number of
transaction.abortedevents, you can subclass the metrics listener, enhance it using the instrumentation API, and publish the relevant information:
class BetterListener < WaterDrop::Instrumentation::Vendors::Datadog::MetricsListener
  def on_transaction_aborted(_event)
    count('transactions_aborted', 1, tags: default_tags)
  end
end

# Create listener instance
listener = BetterListener.new do |config|
  config.client = Datadog::Statsd.new('localhost', 8125)
  # Publish host as a tag alongside the rest of tags
  config.default_tags = ["host:#{Socket.gethostname}"]
end

# Subscribe your listener to the producer
producer.monitor.subscribe(listener)-
Altering
librdkafkaMetrics: Due to the volume and complexity oflibrdkafkastatistical data, the WaterDrop listener allows you to define the metrics of interest by modifying therd_kafka_metricssetting. This method does not require subclassing the listener. For instance, to track throttling metrics on brokers, you can configure the listener as follows:
# Reference for readability
list_class_ref = ::WaterDrop::Instrumentation::Vendors::Datadog::MetricsListener

# Merge default reporting with custom metrics
listener = list_class_ref.new do |config|
  config.rd_kafka_metrics = config.rd_kafka_metrics + [
    list_class_ref::RdKafkaMetric.new(:gauge, :brokers, 'brokers.throttle.avg', %w[throttle avg]),
    list_class_ref::RdKafkaMetric.new(:gauge, :brokers, 'brokers.throttle.p95', %w[throttle p95]),
    list_class_ref::RdKafkaMetric.new(:gauge, :brokers, 'brokers.throttle.p99', %w[throttle p99])
  ]
end

# Subscribe your listener to the producer
producer.monitor.subscribe(listener)
The structure and details about the librdkafka statistical metrics can be found here.
!!! hint "Mixing Approaches"
Both notification hook enhanced reporting and altering librdkafka metrics can be combined to create a custom listener that fully suits your monitoring needs.