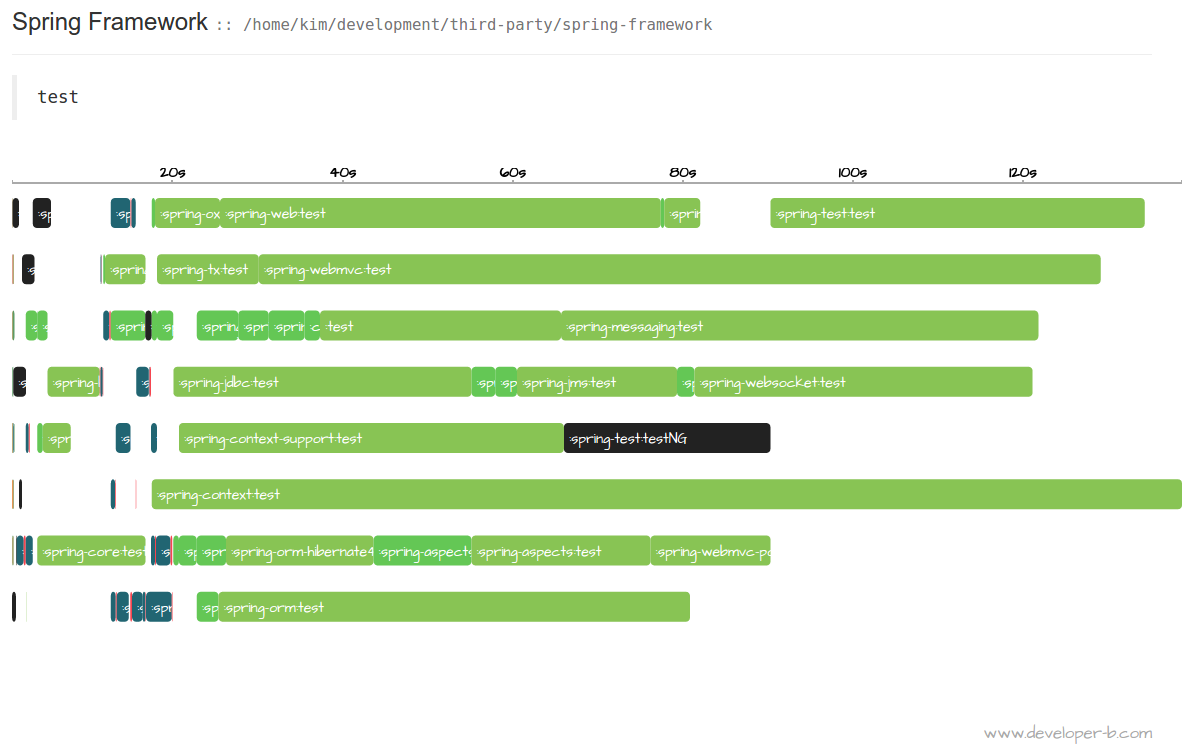
I like visualizing things and I finally had some time to play around with Gradle and D3.js. The end result is this plugin visualizing when and how long various tasks are running. My hope is that this will be helpful when it comes to identifying and eliminating internal dependencies preventing Gradle from making maximum use of all those cpu cores we now have.
Have a look at the page over at plugins.gradle.org.
After each build the plugin will create a report under {buildDir}/reports/task-profile-report.
- Once it's included in your project it is always running - I'm sure there is a Gradle-ish way of doing this.
- Some browsers doesn't like the way I load json into the html report when running from the filesystem.
A quick workaround for this problem is to run
python -m SimpleHTTPServer 8000from the report folder and look at the reports at http://localhost:8000 .