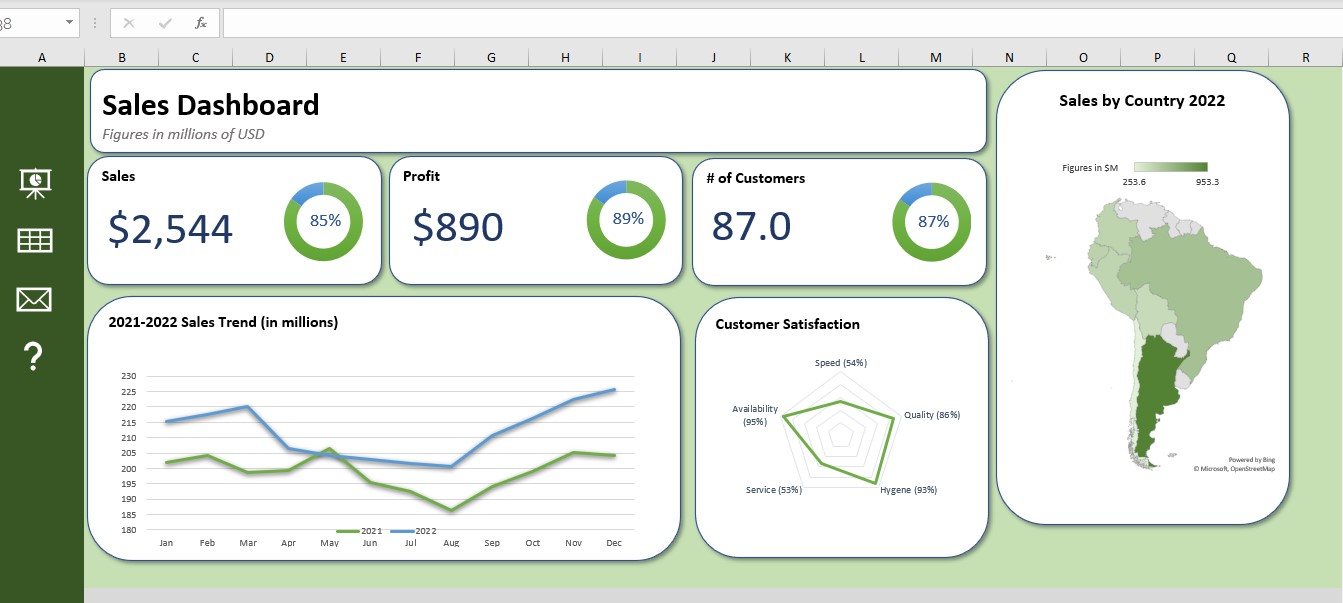
An interactive, dynamic dashboard for Excel using example data of a fast food chain in South America.
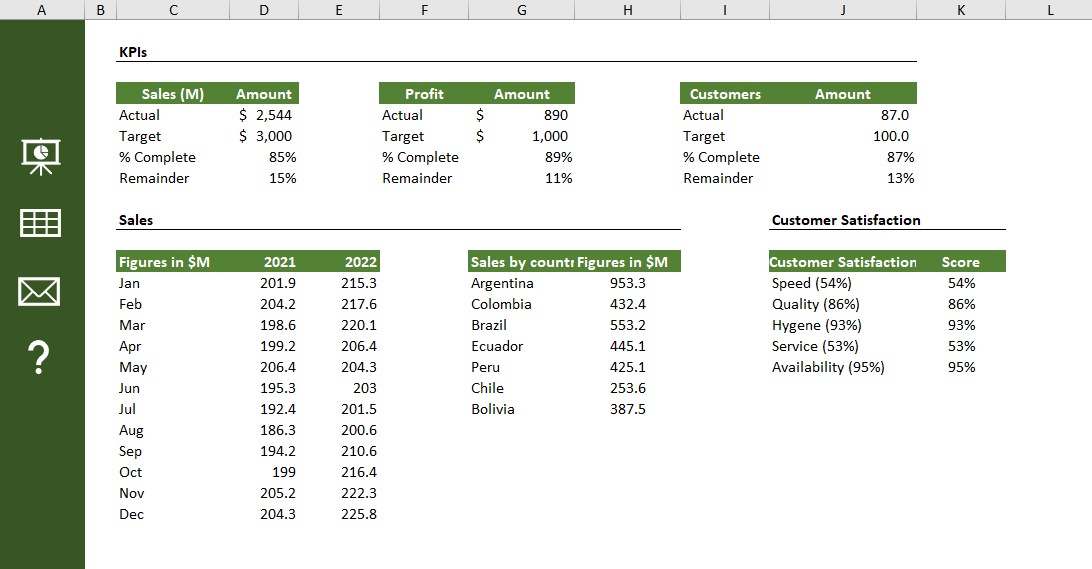
The following shows the data's KPIs, sales, and customer satisfaction numbers.
This image shows the data visualized in a dashboard, containing a map chart, radar chart, line chart, donut chart, and dynamic displays of sales, profit, and number of customers.