
The KGy SOFT Drawing Tools repository contains a couple of applications and some Debugger Visualizers for several GDI+, WPF and SkiaSharp types such as Bitmap, Metafile, Icon, BitmapData, Graphics, ImageSource, SKBitmap, etc. (see also below). The visualizers use KGy SOFT Imaging Tools to display these types visually, which can be executed as a standalone application as well.


KGy SOFT Imaging Tools on Windows 10
The Imaging Tools application makes possible to load images and icons from file, manipulate and save them into various formats. Several modifications are possible such as rotating, resizing, changing pixel format with quantizing and dithering, adjusting brightness, contrast and gamma, or even editing the palette entries of indexed bitmaps.

Changing Pixel Format with Quantizing and Dithering
💡 Tip: As a developer, you can access all of these image manipulaion functions by using KGy SOFT Drawing Libraries. It supports not just
System.Drawingtypes but also completely managed and technology agnostic bitmap data manipulation as well.
KGy SOFT Imaging Tools supports a wide range of platforms. Windows is supported starting with Windows XP but by using Mono you can execute it also on Linux. See the downloads for details.

KGy SOFT Imaging Tools on Ubuntu Linux, using dark theme

KGy SOFT Imaging Tools on ReactOS
KGy SOFT Imaging Tools supports localization from .resx files. New language resources can be generated for any languages, and you can edit the texts within the application. The changes can be applied on-the-fly, without exiting the application. If you switch to a right-to-left language, then the layout is also immediately applied (at least on Windows).
💡 Tip: As a developer, you can use KGy SOFT Core Libraries if you want something similar in your application.
The edited resources are saved in .resx files in the Resources subfolder of the application. Resources can be downloaded from within the application as well.

Editing resources in KGy SOFT Imaging Tools
📝 Note: If you create a localization for your language feel free to submit a new issue and I will make it available for everyone. Don't forget to mention your name in the translated About menu.
If you use Imaging Tools as debugger visualizers, then it can be executed from various locations. See the bottom of the Troubleshooting section below.
Imaging Tools is packed with several debugger visualizers for Visual Studio (compatible with all versions starting with Visual Studio 2008, and supports even .NET Core 2.1 and newer platform targets). When a type is debugged in Visual Studio and there is a debugger visualizer installed for that type, then a magnifier icon appears that you can click to open the visualizer.

Debugger Visualizer Usage
Either click the magnifier icon or choose a debugger visualizer from the drop down list (if more visualizers are applicable).

Debugging a Graphics instance
The debugger visualizers are invoked from different assemblies:
- The
KGySoft.Drawing.DebuggerVisualizers.GdiPlusassembly supports the following types:System.Drawing.Image: If executed for a non read-only variable or member of typeImage, then the actual value can be replaced by anyBitmaporMetafile.System.Drawing.Bitmap: Supports multi-page, multi-resolution and animatedBitmapinstances. The bitmap can be saved in many formats. In a non read-only context the bitmap can be replaced from file and its palette (for indexed bitmaps) can be edited.System.Drawing.Imaging.Metafile: Unlike many other image debugger visualizers, this one does not transform the metafile into a low-resolution PNG image because it is able to serialize the actual metafile content. The metafile can be saved into EMF/WMF formats. In a non read-only context the image can be replaced from file.System.Drawing.Icon: Supports compound and huge icons even in Windows XP. The icon can be saved, and in a non read-only context it can be replaced from file.System.Drawing.Imaging.BitmapData: Even for indexed data; however, the palette information cannot be retrieved.System.Drawing.Graphics: Supports both image and native window graphics.System.Drawing.Imaging.ColorPalette: In a non read-only context the colors can be edited.System.Drawing.Color: In a non read-only context the color can be replaced.
- The
KGySoft.Drawing.DebuggerVisualizers.Wpfassembly supports the following types (in read-only mode):System.Windows.Media.ImageSource: All derived types are supported, including vector images (System.Windows.Media.DrawingImage) and bitmaps (types derived fromSystem.Windows.Media.Imaging.BitmapSourcesuch asBitmapFrame,BitmapFrame,WriteableBitmap, etc.). Vector images are displayed as bitmaps, adjusted to the size of the primary display.System.Windows.Media.Imaging.BitmapPalette: Color entries can be examined individually.System.Windows.Media.Color: sRGB, ScRGB, and colors with context profile are all supported.
- The
KGySoft.Drawing.DebuggerVisualizers.SkiaSharpassembly supports the following types (in read-only mode):SkiaSharp.SKBitmap: All color/alpha types of any color space are supportedSkiaSharp.SKImageSkiaSharp.SKPixmapSkiaSharp.SKSurface: All back-ends are supportedSkiaSharp.SKColor
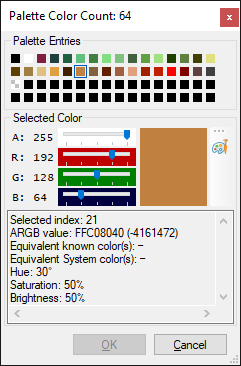
Debugging a ColorPalette instance
If you use Visual Studio 2013 or newer, then you can perform the install directly from Visual Studio by the Extensions/Manage Extensions (older Visual Studio versions: Tools/Extensions and Updates...) menu if you search for the "KGy SOFT Image DebuggerVisualizers" extension.
Alternatively, you can download the installer package from the VisualStudio Marketplace. There are two versions available:
- A 32-bit version for Visual Studio 2013-2019
- And a 64-bit version for Visual Studio 2022
- Download the binaries and extract the .7z archive to any folder.
- Open the folder with the extracted content. You will find five folders there:
net35contains the .NET Framework 3.5 build. Compatible with all Visual Studio versions starting with Visual Studio 2008 (tested with versions 2008-2019). Cannot be used to debug .NET Core applications.net40contains the .NET Framework 4.0 build. It requires at least Visual Studio 2010 but it's compatible even with Windows XP and ReactOS. Cannot be used to debug .NET Core applications.net45contains the .NET Framework 4.5 build. It requires at least Windows Vista SP2 and Visual Studio 2012. With some limitations supports also .NET Core/.NET projects (in case of issues see the Troubleshooting section).net462contains the .NET Framework 4.6.2 build. It requires at least Windows 7 SP1 and Visual Studio 2012. It contains also the SkiaSharp debugger visualizers, which is not included into the other builds. With some limitations supports also .NET Core/.NET projects (in case of issues see the Troubleshooting section).net6.0-windowscontains the .NET 6.0 binaries of the Imaging Tools application. Debugger visualizers are not included because it would not be recognized by Visual Studio anyway.
- Execute
KGySoft.Drawing.ImagingTools.exefrom one of the folders listed above. Click the Manage Debugger Visualizer Installations... button (the gear icon) on the toolbar.
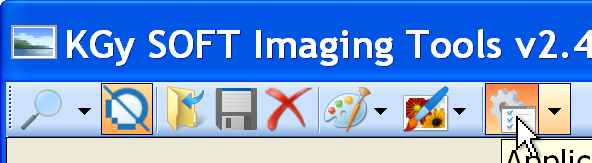
Installing Debugger Visualizers from Imaging Tools
📝 Note: Starting with version 2.1.0 the debugger visualizers can be used also for .NET Core projects from Visual Studio 2019, even though no .NET Core binaries are used.
- In the drop down list you will see the identified Visual Studio versions in your Documents folder. You can select either one of them or the <Custom Path...> menu item to install the visualizer debuggers into a custom folder.

Selecting Visual Studio Version
- Click on the Install button. On success the status will display the installed version.

Installation Complete
If Visual Studio cannot load the visualizer or you have other debugger visualizer related problems check this table.
| Issue | Solution |
|---|---|
| The magnifier icon does not appear |
Debugger Visualizers are not installed for the Visual Studio version you use. Check the installation steps above. Make sure you select the correct version from the list. |
Could not load this custom viewer. |
Open Debug / Options / Debugging / General and make sure that both Use Managed Compatibility Mode and Use legacy C# and VB expression evaluators are unchecked. |
An unhandled exception of type 'System.InvalidOperationException' was thrown by the custom visualizer component in the process being debugged. (Object is currently in use elsewhere.) |
You try to debug a Graphics instance, whose Device Context is in use (the GetHdc method has been called previously). This Graphics instance cannot be accessed until the ReleaseHdc method is called. |
The target process exited with code -2146233082 (0x80131506) while evaluating the function 'System.Runtime.CompilerServices.RuntimeHelpers.GetHashCode'. |
Occurs in Visual Studio 2022 when attempting to debug a Color instance.The bug has been reported to the VisualStudio team. |
Unable to perform function evaluation on the process being debugged (Unable to evaluate expression because the code is optimized or a native frame is on top of the call stack.) |
Can occur even with debug build, typically when debugging a .NET Core project. When it happens, then likely all members in the debug window show a similar error message. Perform a Step Over operation (F10 by default)/Set Next Statement (Ctrl+Shift+F10), or restart the debugging session and try again. |
Unable to perform function evaluation on the process being debugged (Function evaluation timed out) |
It can happen that the visualizer loads too slowly for the first time. Just try to click the magnifier icon again, which usually solves the problem. If all members in the debug window show an error, then perform a Step Over operation first (F10 by default). |
Unable to load the custom visualizer (Operation is not valid due to the current state of the object) |
Typically happens after timeout. Likely all members in the debug window show a similar error message. Perform a Step Over operation (F10 by default)/Set Next Statement (Ctrl+Shift+F10), or restart the debugging session and try again. |
An unhandled exception of type 'System.NullReferenceException' was thrown by the custom visualizer component in the process being debugged. |
• Occurs when you clear the debugged image in Visual Studio 2019, which does not support nullifying the debugged value. The bug has been reported to the VisualStudio team. • Occurs in Visual Studio 2019 also when replacing a Color entry in an array by the visualizer.The bug has been reported to the VisualStudio team. |
The Color visualizer appears in read-only, even though the debugged value is in a read-write context (eg. local variable). |
Occurs with some specific builds of Visual Studio 2019 The bug has been reported to the VisualStudio team as part of another issue. |
Unable to load the custom visualizer. (Exception of type 'System.Exception' was thrown) |
Occurs when you debug a project that targets .NET Framework 3.5 or earlier versions. You can either target at least .NET Framework 4.0 (at least temporarily, for debugging), or you can manually install the .NET Framework 3.5 version of the Debugger Visualizers (which cannot be used to debug the .NET Core targets, though). |
Unable to load the custom visualizer. (The debuggee-side visualizer assembly 'KGySoft.Drawing.DebuggerVisualizers, Version=[...]' was not found at path '<Documents>\Visual Studio <version>\Visualizers\netstandard2.0'.)![The debuggee-side visualizer assembly 'KGySoft.Drawing.DebuggerVisualizers, Version=[...]' was not found.](https://kgysoft.net/images/DebuggerVisualizerTrShNotFoundStandard20.png) |
Occurs when you try to debug a .NET Core project with the .NET Framework 3.5/4.0 builds installed. To debug .NET Core projects you need to install the .NET Framework 4.5 version. |
An unhandled exception of type 'System.TypeInitializationException' was thrown by the custom visualizer component in the process being debugged. (The type initializer for 'KGySoft.CoreLibraries.XXXX' threw an exception.) |
Occurs when you try to debug a .NET Core project while the .NET Framework 3.5 binaries of the debugger visualizers are deployed in the netstandard2.0 subfolder. To debug .NET Core projects you need to install the .NET Framework 4.5 version. |
An unhandled exception of type 'System.IO.FileLoadException' was thrown by the custom visualizer component in the process being debugged. (Could not load file or assembly 'KGySoft.CoreLibraries / KGySoft.Drawing, Version=####'.) |
If you debug a .NET Core project that also references KGySoft assemblies, then the versions referenced by the debugger visualizers and your project must match; otherwise, you get this error. If the version in the message is higher than the one your project references, then simply upgrade the references of your project. Otherwise, as the issue does not occur when targeting .NET Framework, you can try to change the targeted framework in the .csproj file for the debugging. |
An unhandled exception of type 'System.Exception' was thrown by the UI-side custom visualizer component. |
Occurs when you clear the debugged image in Visual Studio 2017, which does not support nullifying the debugged value. |
Could not evaluate expression. |
Occurs when you clear the debugged image in Visual Studio 2015, which does not support nullifying the debugged value. |
An unhandled exception of type 'System.TypeLoadException' / 'System.MissingMethodException' was thrown by the custom visualizer component in the process being debugged.  |
You are probably debugging a .NET Core 2.0 application referencing the System.Drawing.Common NuGet package. The project should target at least .NET Core 2.1 to be able to debug System.Drawing types. |
Unable to load the custom visualizer (serializer could not be resolved). |
The project you debug references an unmatching version of the Microsoft.VisualStudio.DebuggerVisualizers assembly to your actual VisualStudio version. |
Unable to load the custom visualizer (The UI-side visualizer type must derive from 'DialogDebuggerVisualizer'). |
The Microsoft.VisualStudio.DebuggerVisualizers.dll has been copied to the debugger visualizers installation folder. Recent Visual Studio versions can handle if a debugger visualizer references an unmatching version of this assembly but only if this assembly is not deployed along with the visualizers. |
Could not load file or assembly 'KGySoft.Drawing.DebuggerVisualizers.dll' or one of its dependencies. |
Visual Studio 2008 supports the .NET 3.5 version only. A similar error may occur even if some files are missing. Just install a correct version again. |
Value does not fall within the expected range. |
Windows XP does not support the .NET 4.5 version. |
| The app looks blurry. | If you changed the DPI settins, you need to restart the application. Per-monitor DPI awareness is not supported. |
The visual elements are scaled incorrectly. |
May happen if you use Imaging Tools from debugger visualizers, and you have just changed the DPI settings without signing out/in. However, signing in and out is not required if you execute the app directly. |
| I edited the language resource files but I cannot find them (or they appear to be gone) | The Visual Studio/Tools/KGy SOFT Image Debugger Visualizers and clicking the magnifier icon executes the Imaging Tools from different locations. If you edit the language resources at one place they will not be automatically applied at the other place. Therefore, the saved resources might be at different possible locations: • If you execute a manually deployed version the resources will be in a Resources subfolder in the folder you executed the Imaging Tools from.• During debugging the tool is executed from the debugger visualizers folder: Documents\Visual Studio <version>\Visualizers• If you launch the tool from the Visual Studio Tools menu, then it is located under ProgramData\Microsoft\VisualStudio\Packages\... |
💡 Tip: See above how to download the debugger visualizer installers
You can download the sources and the binaries as .7z/.zip archives at the releases page.
To support the widest possible range of platforms the binaries archive contains multiple builds in different folders.
net35: This contains the .NET Framework 3.5 build and though it works on every platform supported by Imaging Tools, it is not really recommended to use as a standalone application. If you use Imaging Tools as debugger visualizers, then this is the only version you can use for Visual Studio 2008. For newer Visual Studio versions use it only if you want to debug a .NET Framework 2.0-3.5 application.net40: This is the .NET Framework 4.0 build. As a standalone application, it's basically recommended for Windows XP and ReactOS only. As a debugger visualizer you need this one for Visual Studio 2010 to debug .NET Framework 4.0 projects.net45: This is the .NET Framework 4.5 build. Requires Windows Vista or later. As a debugger visualizer works both for .NET Framework 4.x and .NET Core projects (including .NET 5 and newer platforms) but does not support debugging SkiaSharp types.net462: This is the .NET Framework 4.6.2 build. Requires Windows 7 or greater, and this is the recommended version to use as a debugger visualizer for .NET Framework 4.x and .NET Core projects (including .NET 5 and newer platforms). As a standalone application, this is also the recommended version for Linux (requires Mono).net6.0-windows: This folder contains the .NET 6.0 build. As a standalone application this is the recommended version for Windows 7 and above. On the other hand, this one cannot be used as a debugger visualizer (even for .NET or .NET Core projects) and cannot be executed on Linux either.
See the change log.
This repository is under the KGy SOFT License 1.0, which is a permissive GPL-like license. It allows you to copy and redistribute the material in any medium or format for any purpose, even commercially. The only thing is not allowed is to distribute a modified material as yours: though you are free to change and re-use anything, do that by giving appropriate credit. See the LICENSE file for details.