3D geoms for plotnine (grammar of graphics in Python).
Status: experimental. Please leave feedback; pull requests welcome.
Please refer to the notebook with examples for more details on data preparation.
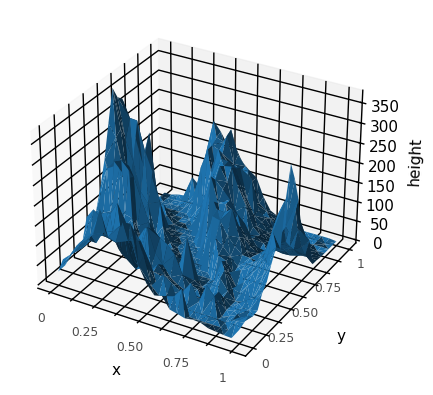
(
    ggplot_3d(mt_bruno_long)
    + geom_polygon_3d(size=0.01)
    + aes(x='x', y='y', z='height')
    + theme_minimal()
)
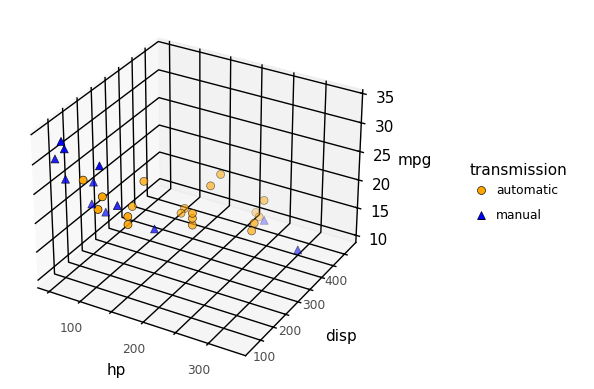
(
    ggplot_3d(mtcars)
    + aes(
        x='hp', y='disp', z='mpg',
        shape='transmission',
        fill='transmission'
    )
    + theme_minimal()
    + scale_shape_manual(values={'automatic': 'o', 'manual': '^'})
    + geom_point_3d(stroke=0.25, size=3, color='black')
    + scale_fill_manual(values={'automatic': 'orange', 'manual': 'blue'})
)
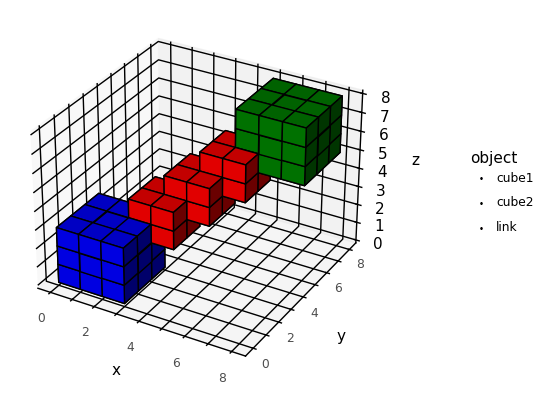
(
    ggplot_3d(voxels_long)
    + aes(x='x', y='y', z='z', fill='object')
    + geom_voxel_3d(size=0.01)
    + theme_minimal()
    + ylim(0, 8)
    + xlim(0, 8)
    + scale_fill_manual(values={
        'link': 'red',
        'cube1': 'blue',
        'cube2': 'green'
    })
)
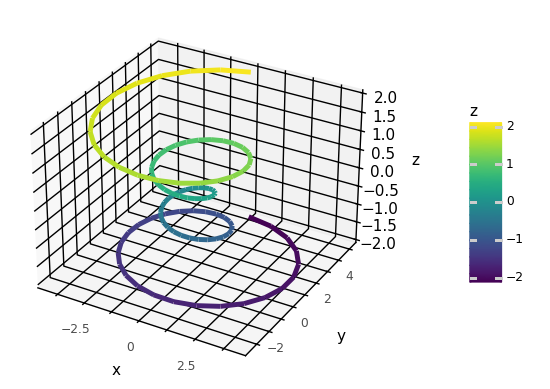
(
    ggplot_3d(data)
    + aes(x='x', y='y', z='z', color='z')
    + geom_line_3d(size=2)
    + theme_minimal()
)
Installation from PyPI:
pip install plotnine3d