Tracing overview
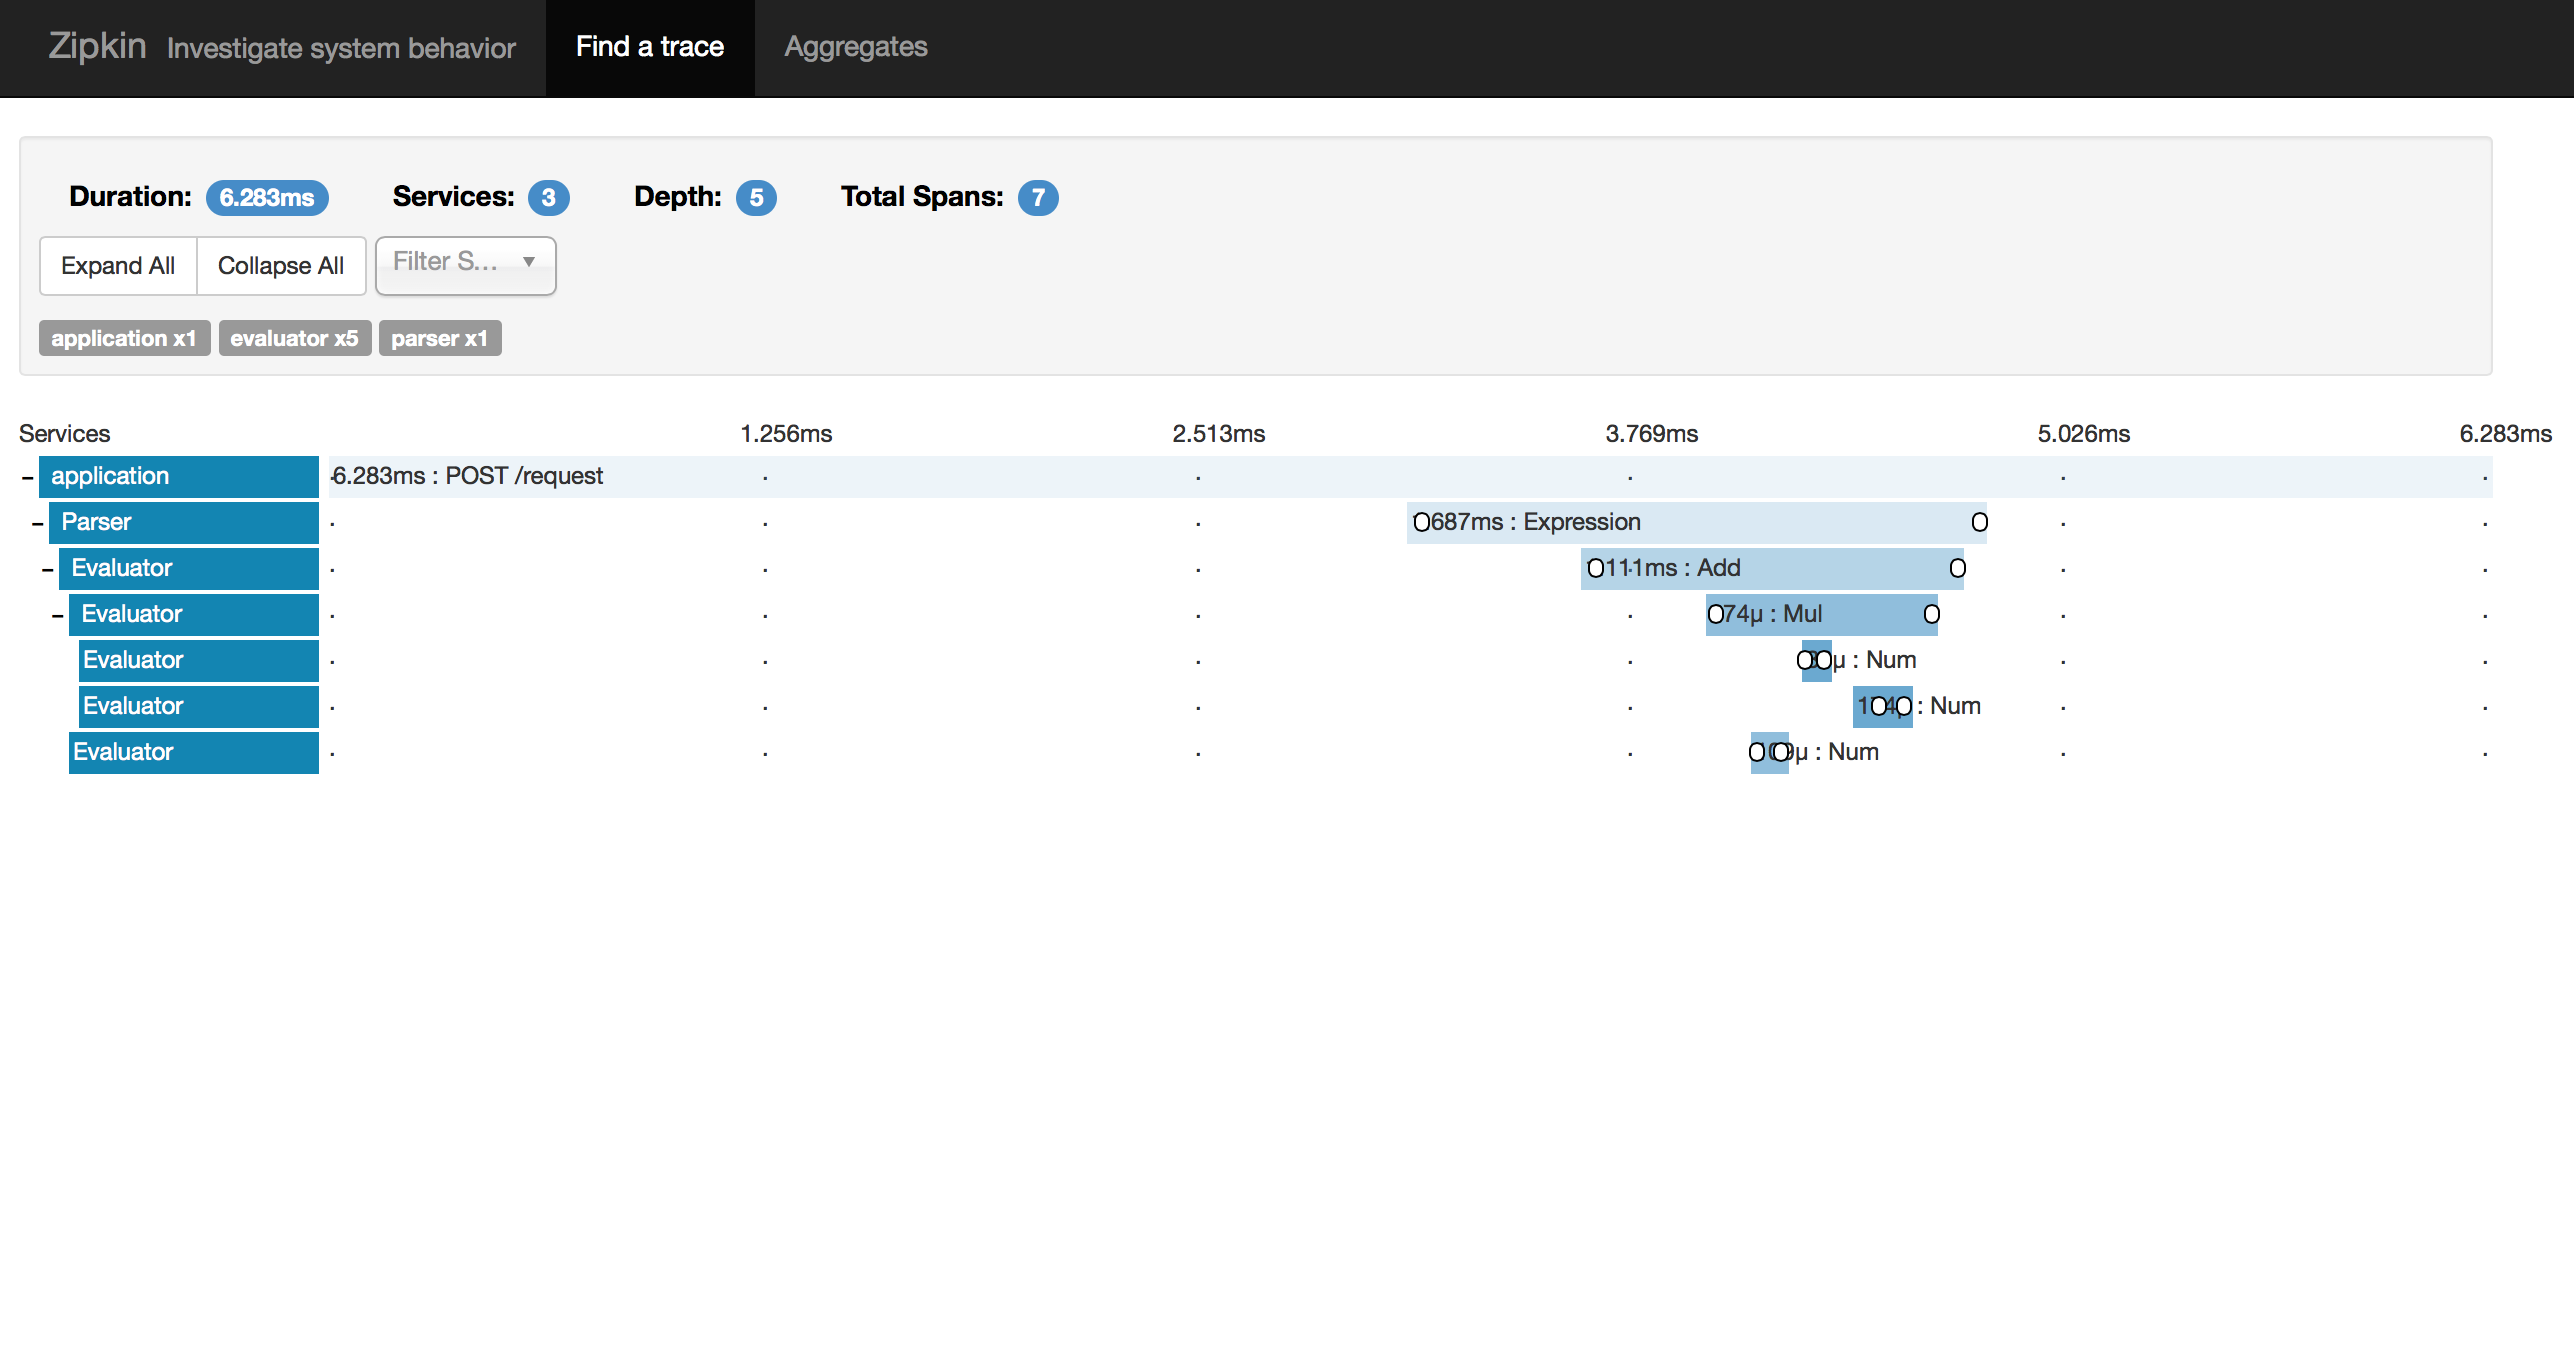
The main feature of tracing is ability to record "logs" attached to incoming requests. Requests can form hierarchies: for example when you split processing into two pipelines which work independently, or you delegate some part of processing to underlying service. Such request hierarchy is represented in Zipkin by a trace, where each request has it's own span (visible as bars on time diagram):
You can see any "logs" written to a specific span by clicking on it:
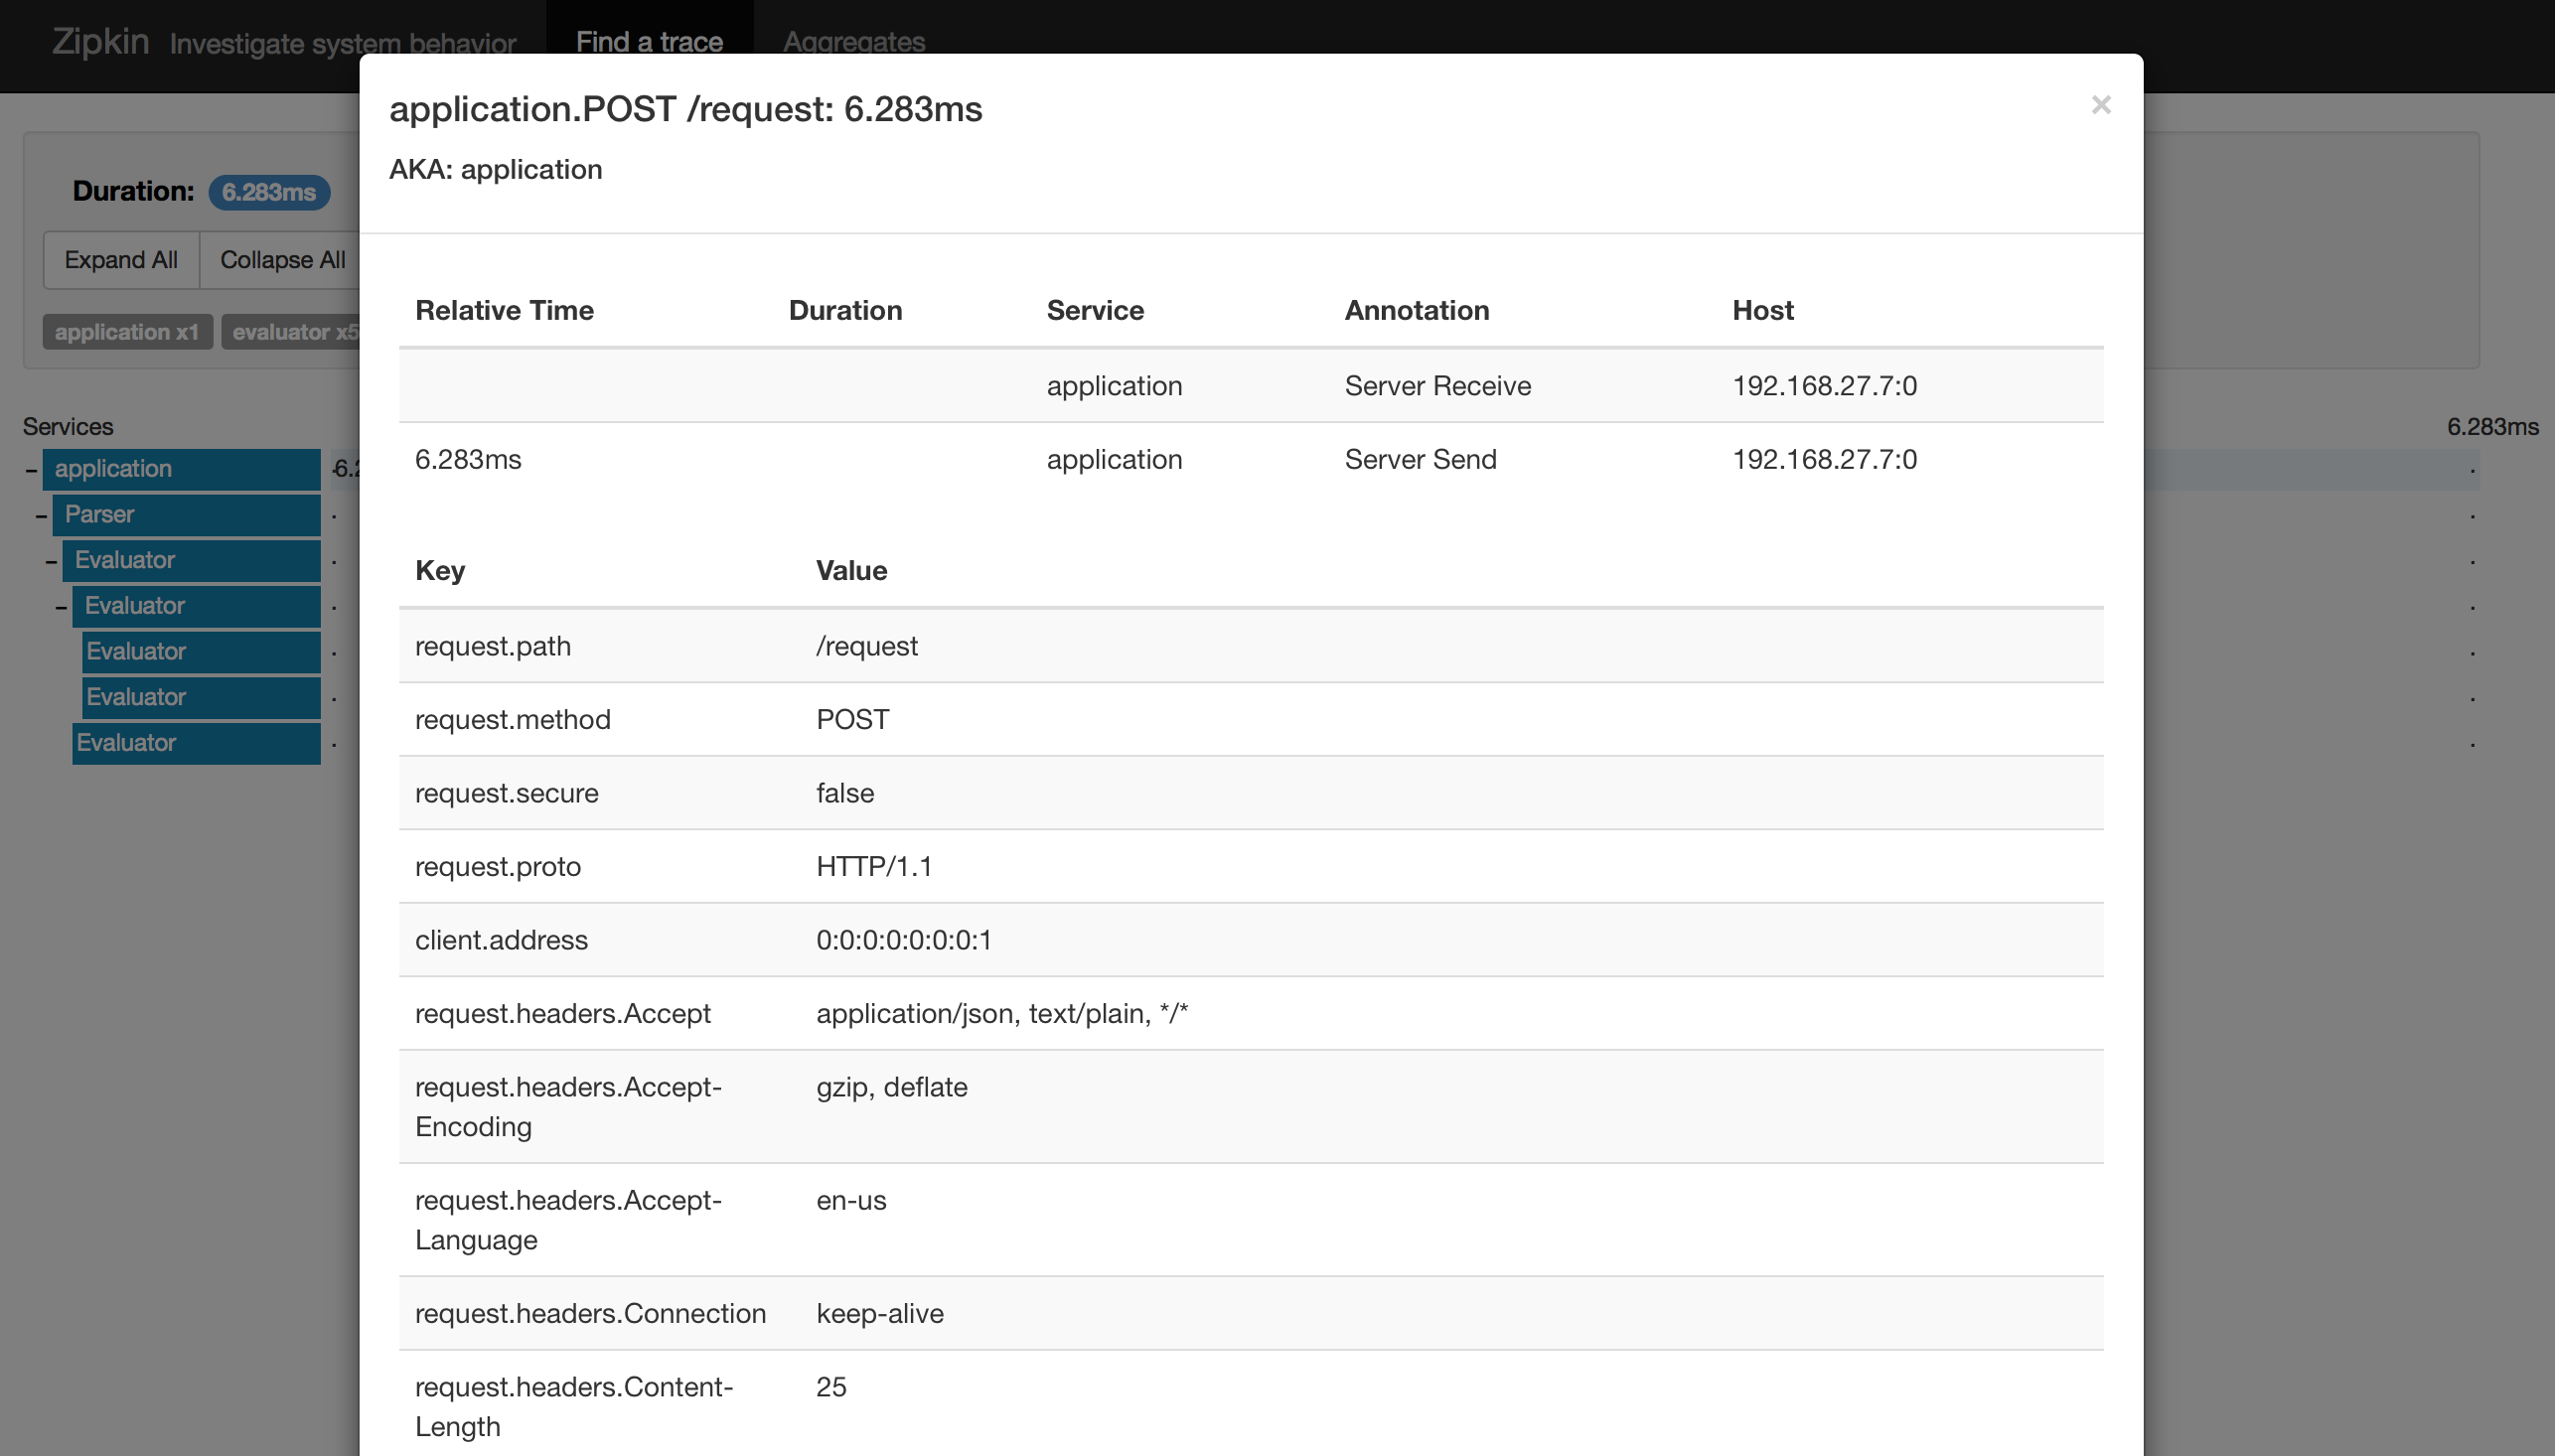
These "logs" are called basic and binary annotations in terms of Zipkin. Basic annotations contain timestamp and description and can be displayed on a timeline. Binary annotations are key-value pairs attached to trace itself.
Before a trace is created, incoming request passes the sampling phase. This allows to reducing overhead by tracing only small part of incoming requests. Sample rate can be set using application config (see Instrumentation).
The extension supports trace propagation mechanism. It means that requests passed from external system (which supports Zipkin too) will inherit sampling decisions made previously.
All tracing data are stored in the extension until it is notified that corresponding request processing was finished, or until submitting timeout occurs. Any annotations written to already submitted traces are lost.