NOTE: This plugin is no longer maintained by LinkSmart. Please visit frost-sensorthings-datasource.
A Grafana Data Source plugin to query observation and location data from an OGC SensorThings server for visualization on Grafana panels.
It provides:
- Observations for panels such as Graph, Table, Singlestat
- Historical Locations (along with coordinates and Observations) for panels such as Table, Worldmap Panel
- JSONPath expression support for selection of values from result objects
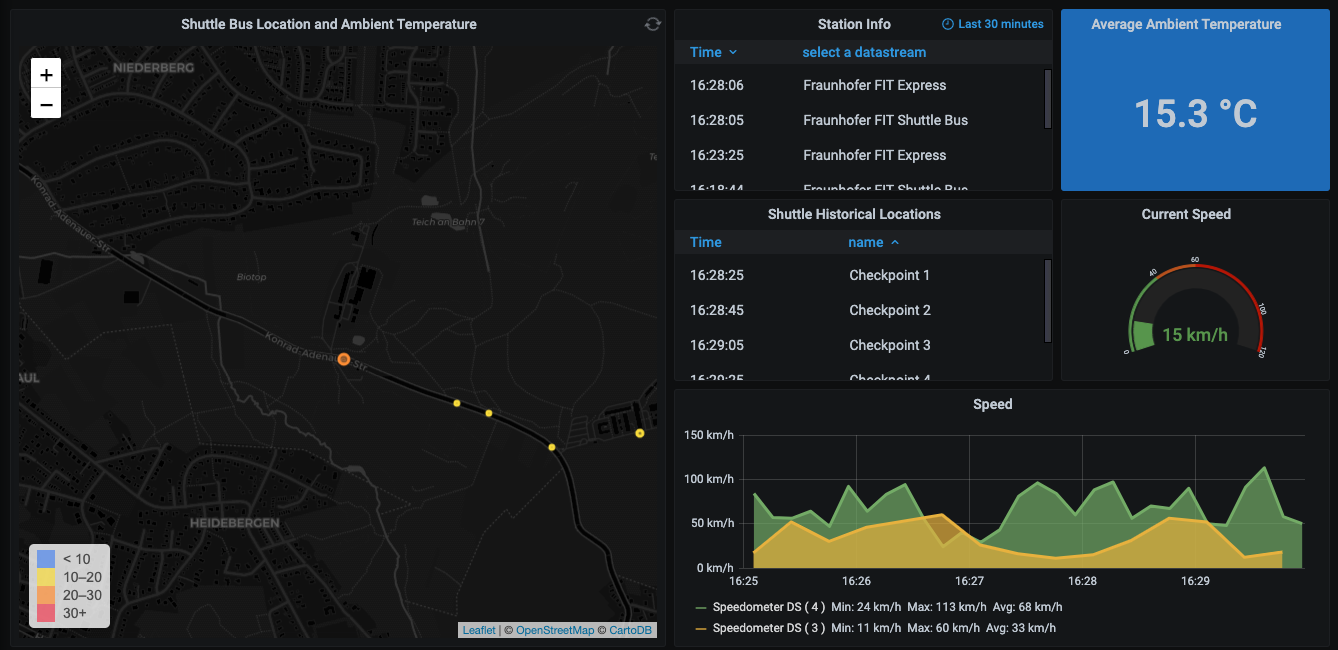
A live dashboard showing SensorThings data in Grafana panels: SensorThings Dashboard
- Install the plugin (see below)
- Go to Grafana Configuration.
- Select
Add data source. - Provide the necessary details to connect to the OGC SensorThings server. Note that the URL field must be set to OGC SensorThings API root endpoint (e.g.
http://localhost:8080/v1.0), without trailing slash. - Save & Test, you should see this confirmation:

There are several ways to query Observations and Locations. The Observations are sorted descendingly by phenomenonTime.
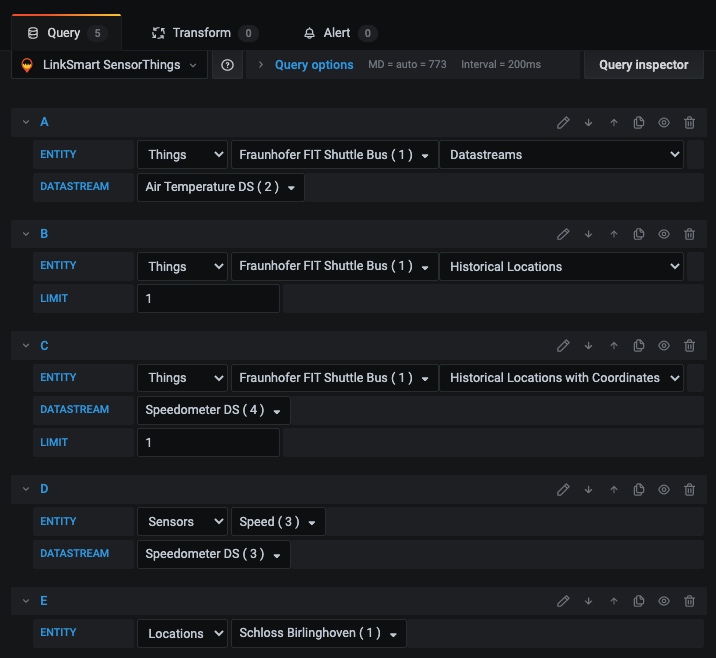
The queries options are:
- (A) Get Observations by Thing/Datastream
- (B) Get Historical Locations by Things
- (C) Get Historical Locations, coordinates, and Observations by Thing
- (D) Get Observations by Sensor
- (E) Get Things by Location
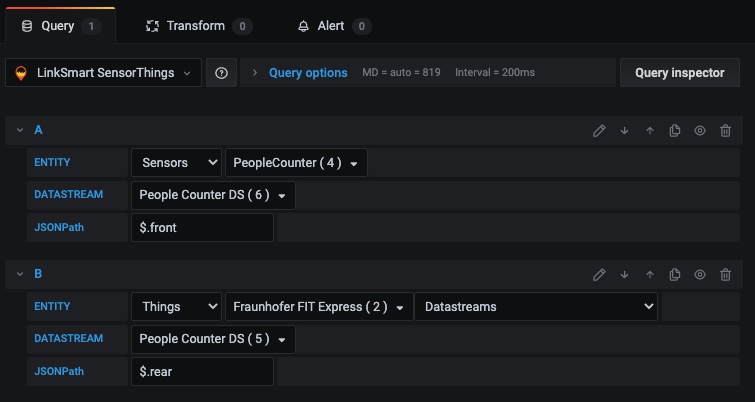
If the Datastream has OM_Observation for observationType, the particular values can be selected from the result object inside each Observation. The selection can be done using JSONPath expressions. Few examples are available here.
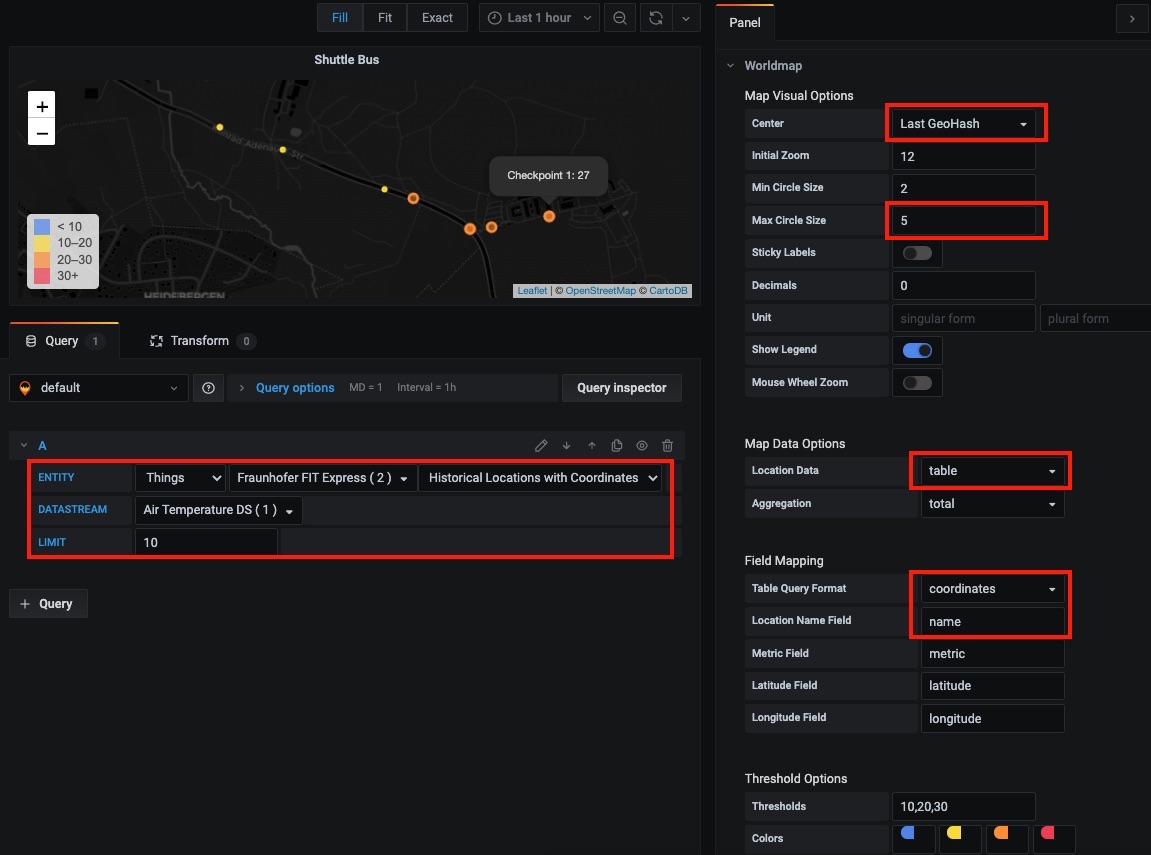
Using the Grafana Worldmap Panel, one can see latest Locations of Things on the map. Currently, only a single Thing can be visualized.
-
Install world map panel from grafana plugin store.
-
Add the map panel in dashboard
-
Under
Worldmaptab of the panel configuration:-
Map Visual Options:- Set
CentertoLast GeoHash - Set
Max Circle Sizeto 5
- Set
-
Map Data Options:- Set
Location DatatoTable
- Set
-
Field Mapping:- Set
Table Query Formattocoordinates - Set
Location Name Fieldtoname
- Set
-
-
In "Query" tab:
- Select the LinkSmart SensorThings Datasource.
- Select
Thingsand pick a Thing from from the dropdown list. - Select
Historical Locations with Coordinates - Select a Datastream if you want to query the latest observation (per Historical Location) and use that value as metric field. This metric value will determine the size and color of each circle and can be viewed by hovering on the circle.
- Select a Limit value to set how many locations should be retrieved from the history.
Using grafana-cli:
sudo grafana-cli plugins install linksmart-sensorthings-datasource
If using Grafana Docker Image, set container environment variable instead:
GF_INSTALL_PLUGINS=linksmart-sensorthings-datasource
Restart Grafana server.
Clone the repository into Grafana's plugin directory:
git clone https://github.com/linksmart/grafana-sensorthings-datasource.git linksmart-sensorthings-datasource
If using Grafana Docker Image, set container environment variable instead:
GF_INSTALL_PLUGINS="https://github.com/linksmart/grafana-sensorthings-datasource/archive/master.zip;linksmart-sensorthings-datasource"
Restart Grafana server.
npm install
npm run watch