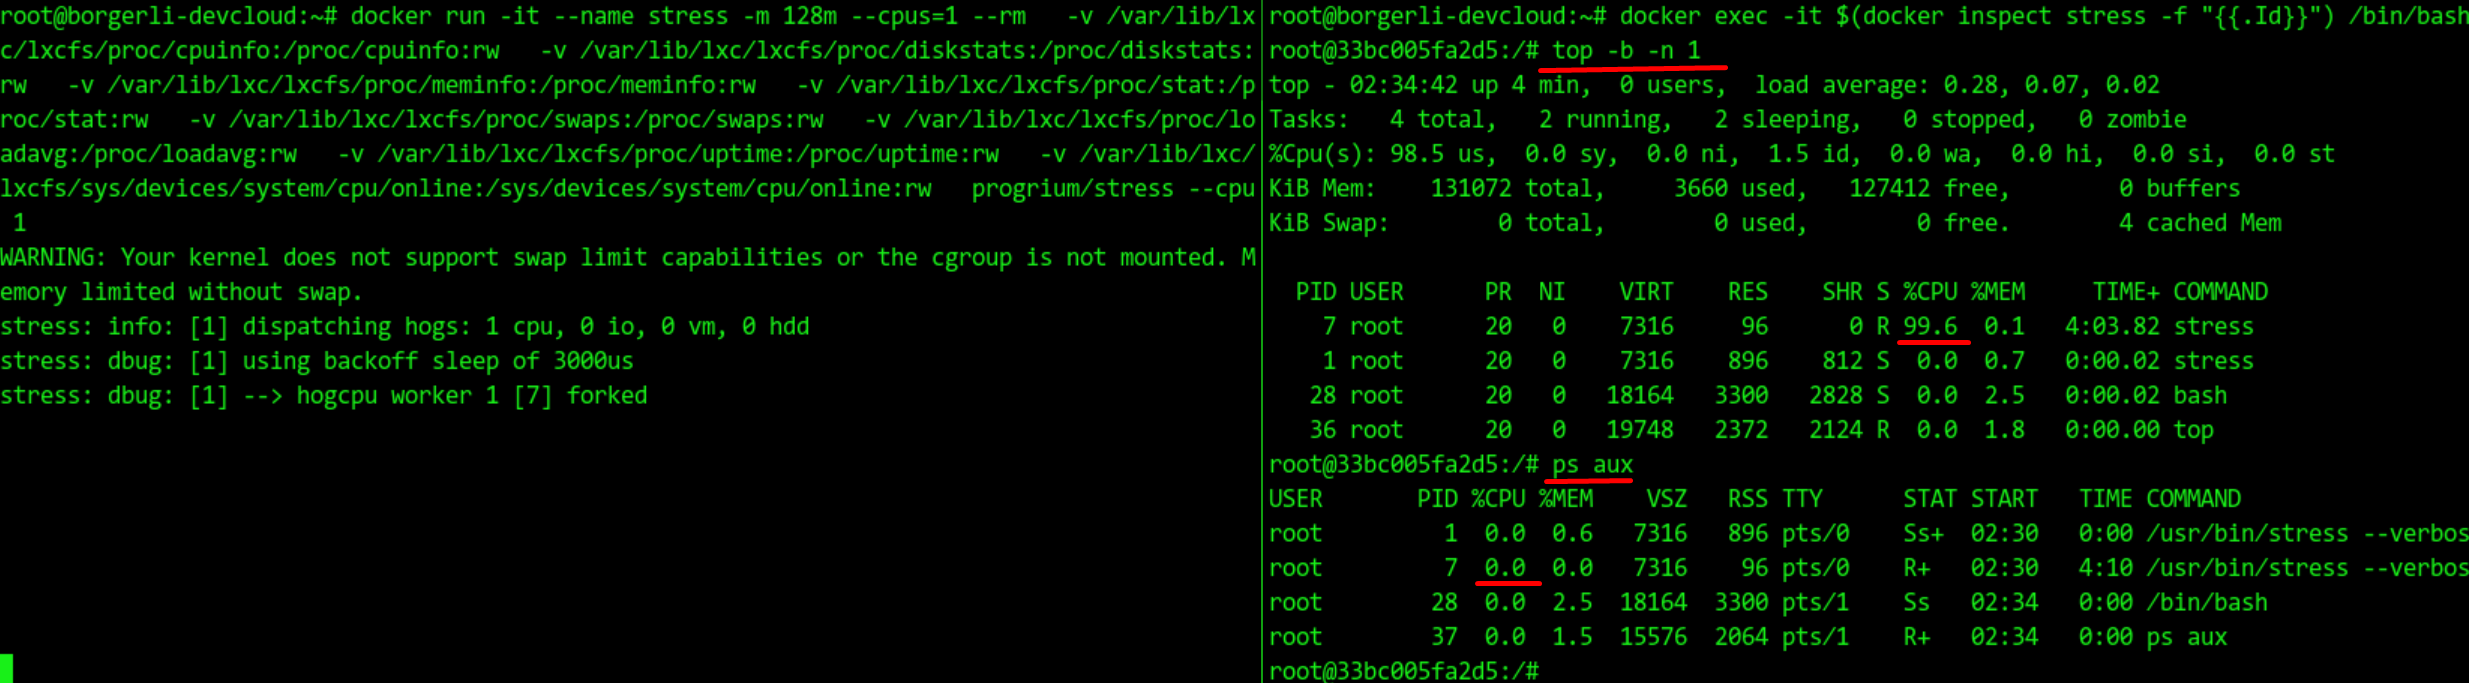
"ps" show 0.0 of %cpu for a busy process in container #444
Comments
|
LXCFS virtualizes cpu utilization according to the cgroup the target process is in. If it's not using a lot of cpu then you won't see anything. Try to create some load by e.g. calling stress with the cpu option inside of the container and you should see an increase. |
|
@brauner Thanks for comment. Acutally, we did run a process which uses lots of cpu(
|
|
Odd, what happens, if you turn off cpu shares, i.e. skip |
|
@brauner I checked procps code related to pcpu, and found the reason of this issue. As shown in below code of procps, if lxcfs uptime mounted in containers, the https://gitlab.com/procps-ng/procps/-/blob/master/ps/output.c#L525: https://gitlab.com/procps-ng/procps/-/blob/master/ps/output.c#L136: A workaround is not to mount lxcfs proc/uptime for containers. But this will make containers lose uptime virtualization. Is it possible for lxcfs to just return host uptime when the calling progress |
|
@brauner Could you please help review the PR? |
|
Hi @borgerli Sorry for a long delay with response from us. We are working on sorting out issues here and there right now. I have read through your PR and understood the idea. But the question is that if we can, instead of adding hacks to LXCFS, fix procps utils not to use the uptime value to calculate CPU load and adjust algorithm to be similar to what we have in |
|
cc @stgraber |
|
Yeah, returning different output based on command name definitely isn't something I'd want is to do. It's way too hacky and will let to an undebugable mess. Tweaking userspace to be a bit smarter would definitely be easier on this case. Especially as there's no way for us to visualize those per-process files. Once we get @mihalicyn 's work to have lxcfs features per container, then you'd also get the ability to turn off the uptime virtualization where it remains problematic. |
I'm using lxcfs 4.0.7. I created an container whit lxcfs proc files mount, then kicked off a process
while true;do echo test > /dev/null;done. In container,topcommand showed the correct %cpu information, whilepsalways showed0.0. However when not using lxcfs,psworked well.Steps
start lxcfs
`/usr/local/bin/lxcfs -l --enable-cfs --enable-pidfd /var/lib/lxc/lxcfs
start docker container
test
topshows100.0, whilepsshows0.0for process 16test without lxcfs
topshows 100.0, andpsshows102The text was updated successfully, but these errors were encountered: