Implement more readable and semantic log graphs #2989
Comments
|
Would it not make more sense to make some of these changes in git itself? |
Well yes, that would be nice, but I don't know enough C to do it that way. |
|
After several years I've started working on a pretty graph again. I've been looking at using SVG for drawing it and had some good results so far. Firstly, it is possible to have SVG and text in the same buffer, it just means the graph needs to be drawn in "tiles", or at least one SVG per line, so that the rest of each line can be text. It seems to work OK, apart from getting the SVGs to tile properly. This seems weird. I had to set the height of the SVGs to double the height of the text otherwise they won't tile, and then the text is aligned in a funny way with the SVGs. I wouldn't be surprised if it looks different when used with other font settings that I have (but playing with The nice thing is this method would allow graphs comparable to those of As a fallback for cases with no SVG support it would be fairly easy for me to improve and modify my old code to be like So, for a normal repo like magit it looks quite nice so far:
My worst case is git.git, which doesn't look awful, but it is possible to improve this by copying
The code is here: https://github.com/georgek/magit-pretty-graph It will break with octopus merges and new heads (ie. if |


|
Very cool! For comparison, modern I must say personally I like tig's better (bias disclaimer: I use tig all the time) for satisfying what you called above property "(1) All commits of a given branch are drawn in the same column, even when that wastes horizontal space." Whereas above svg graph minimizes line crosses and horizonal waste but suffers from branch lines zigzagging all the time making them harder to follow (a problem shared with gitk). In comparison, tig does all splits from the commit they came from, somewhere far below (note the ┴ chars): In this case, the common parent commit is so far down, and so many vertical lines, it's not feasible to follow: (I'm ignoring here colored lines vs B&W. you could always add color later.) BTW, for point (4) above "If a commit is both a merge commit, as well as a branch point", indeed hard with ascii; tig once did it badly but nowday does a pretty good job using ⎨ U+23A8 LEFT CURLY BRACKET MIDDLE PIECE + rounded box drawing: |


|
Essentially the difference between tig and gitk is that tig always grows out by appending to the right, while gitk grows by pushing out from the left. With box drawing the tig algorithm is the only one that works, I think. It's what I came up with when I tried to implement that same in emacs several years ago (I hadn't seen tig at that point). |
|
For comparison, here's gitg on same magit history: But due to the annoying ordering in this case, everything is distant and collapsed, so next page gets very silly: It has a "topological order" configuration toggle, which once upon a time I really loved but nowdays doesn't seem to affect much — only a little bit in "all commits" view :-( |


|
Is there any progress on integrating the display routines from |
|
Regarding display and collapsing, I'd like to suggest a different orientation, which might lead to different answers. Instead of trying to make an arbitrarily complicated commit graph intelligible, suppose magit aimed at the problem of making a graph of PRs that could be un-collapsed to reveal more detail? Many projects/devs end up using rebases and even squashes to keep their commit history from “getting out of hand” even though it hurts bisection, merges, and comprehensibility. If their tools would show them something that hides detail by default (more like what you get from --first-parent), with the ability to explore more deeply when necessary, maybe there would be less history-rewriting-to-make-the-graph-pretty. |
|
I'm going to be that person: if you go ahead with SVG rendering, can that be optional? SVG graphs definitely look pretty, but they won't work on the terminal (same applies to using additional icon fonts, or basically anything outside of UTF-8). Personally, my Emacs+Magit use is split 50/50 between GUI and terminal, and (as far as I know) quite a lot of people use Emacs in terminal (e.g. via SSH), so it would be great to have at least a fallback ASCII/UTF-8 option. |
|
Agreed regarding terminal support. I'd be quite happy if it worked on the terminal just like |
|
Would love to see this come back to life. After about 4 columns my brain stops parsing magit color+ascii logs. |
|
My main gripe with the current log is that leafs of branches are nearly invisible as such -- I'd like them marked to stand out like a sore thumb. |
|
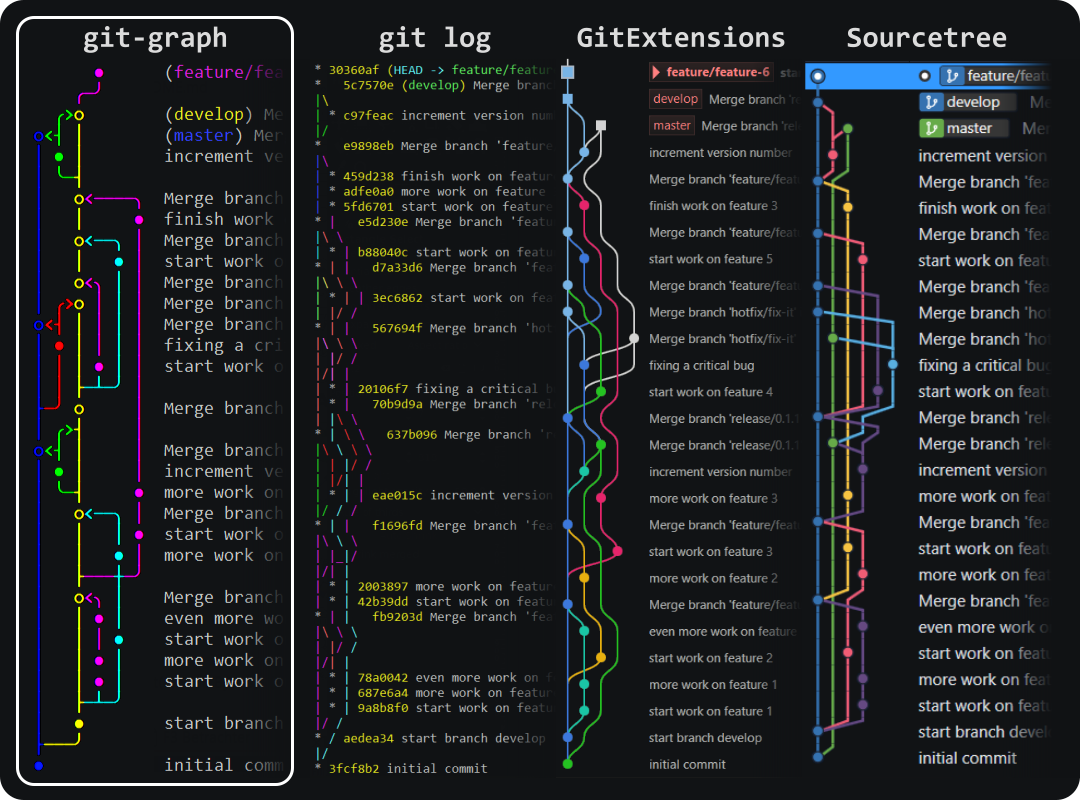
The output of https://github.com/mlange-42/git-graph looks nice. |
I think it's just because I'm not used to it, but in the example given in their README, IMO,
|
|
I think it's the most readable, because there are far fewer overlapping lines. |
|
Not sure if it's helpful, but this article looks interesting and might provide one or two sources of inspiration: https://www.dolthub.com/blog/2024-08-07-drawing-a-commit-graph/ |
|
Not just the output, but one neat aspect of |
|
Here's another comparison, from 2016 but interesting nonetheless. I actually find the Git-Flow one the most readable, but it's not very space-efficient and wouldn't really work in many cases with more than ~20 branches. |
A long time ago there was some talk about making log graphs prettier. See #495, but note that the conversation began before then and continued afterwards.
For a while Magit optionally converted the ascii graph as output by git to use unicode characters instead, as seen in the first screenshot in #495. But that feature broke at some point and I decided to remove it instead of fixing it, see #2343.
At some point in between those two issues, I opened a another issue that outlined various issues with log graphs: #1425. Later I closed that because at the time I considered it a moonshot. The first point on that issue has been addressed by now, or rather we are using a work-around. Still it might be useful to read the initial post on that issue now, before moving on. But this issue replaces #1425.
The core change I still intend to make is to stop using
git log --graphand instead usegit log --parentsand then format our own graphs based on that. We will have to:git log --parentsoutput. This should be easy.I think we have basically two options for drawing the graph. We either draw it using text characters (ascii or unicode, user may choose), or we do so using vector graphics.
If we go with vector graphics, then one option would be svg. Emacs has built-in support for that; you can find a demo here. I don't know whether it is possible to draw over a buffer that also contains text. If it is not, and I suspect it does not, then we might as well use something else that generates an image which is then displayed in a separate window next to the window that contains the commit summaries etc.
A compromise would be continue to draw the graph as (monospaced) text, but to allow individual characters to be replaced with images, or an "image font".
The main reason I find Git's log graphs unreadable as soon as things get a bit more complicated is that it tries to hard to preserve horizontal space. In addition to making the complex graphs very hard to read, this also comes at the cost of wasting vertical space.
To fix that I intend to base our graph drawing on these two principals:
All commits of a given branch are drawn in the same column, even when that wastes horizontal space.
Arrange the branches based on their type (mainline, bug-fix, feature etc.).
Also see Provide mechanism to categorize branches and to select behavior for categories #2948.
A graph might then look like this:
Note how that wastes more horizontal space than
git log --graphwould, but unlike that it wastes no vertical space at all.When using vector graphics, then this would look prettier of course.
We might as well waste even more horizontal space and align the summaries too (this should probably be optional:
Of course such an approach has issues of its own.
We need to avoid wasting too much horizontal space.
feature/stuffuses the same column asfeature/coolbecause the latter was already merged when the former was created.fix/14does not use the same column asfix/13because that wasn't merged yet. Howeverfix/13does use the same column asfix/1because there are many commits in between the lastfix/1commit and the firstfix/13commit.Graphs should probably generated/updated asynchronously. E.g. by the time we first encounter
fix/14, we don't know yet that there is a recentfix/13that hasn't been merged yet.Also logs may be limited to a certain number of commits. So if no commits from
fix/13fall into the limit, thenfix/14would be displayed in the second (not third) column.But users can increase the limit, and then the graph would have to be adjusted, pushing
fix/14to the third column.The plan is to do the initial log parsing asynchronously too {TODO separate issue}. Which means that the graph might have to be adjusted even without user intervention.
Or not. It matters less what part of the log has been inserted into the buffer, then it does what part is actually visible in the window. So moving in the buffer should probably also adjust the graph. But if the graph changes while scrolling, then that is confusing too. So it should only be done if it allows stopping to waste a large amount of horizontal waste. Not easy.
If a commit is both a merge commit, as well as a branch point, then it becomes hard to do express that on a single line when using ascii. With unicode it's easier but still a bit confusing. With vector graphics it's no issue at all.
Express this:
without any waste. Using ascii it looks confusing:
Graph lines may "cross". That's also not easily expressed using ascii, sub-optimal in unicode, and not much of an issue using vector graphics.
Many others. To be updated.
Other details to take care of:
The text was updated successfully, but these errors were encountered: