Home
Krona allows hierarchical data to be explored with zooming, multi-layered pie charts. Krona charts can be created using an Excel template or KronaTools, which includes support for several bioinformatics tools and raw data formats. The interactive charts are self-contained and can be viewed with any modern web browser (see Browser support).
- Miscellaneous
-
Nutrition facts for granola
-
-
- Metagenomics
-
RDP classification of 16s reads from Moving pictures of the human microbiome [Caporaso et al.]
-
-
-
-
PhymmBL classification of MetaHIT human gut sample MH0072 [Qin et al.]
-
-
-
METAREP vertical profile of South Pacific Gyre bacterioplankton [Pham et al.]
-
-
-
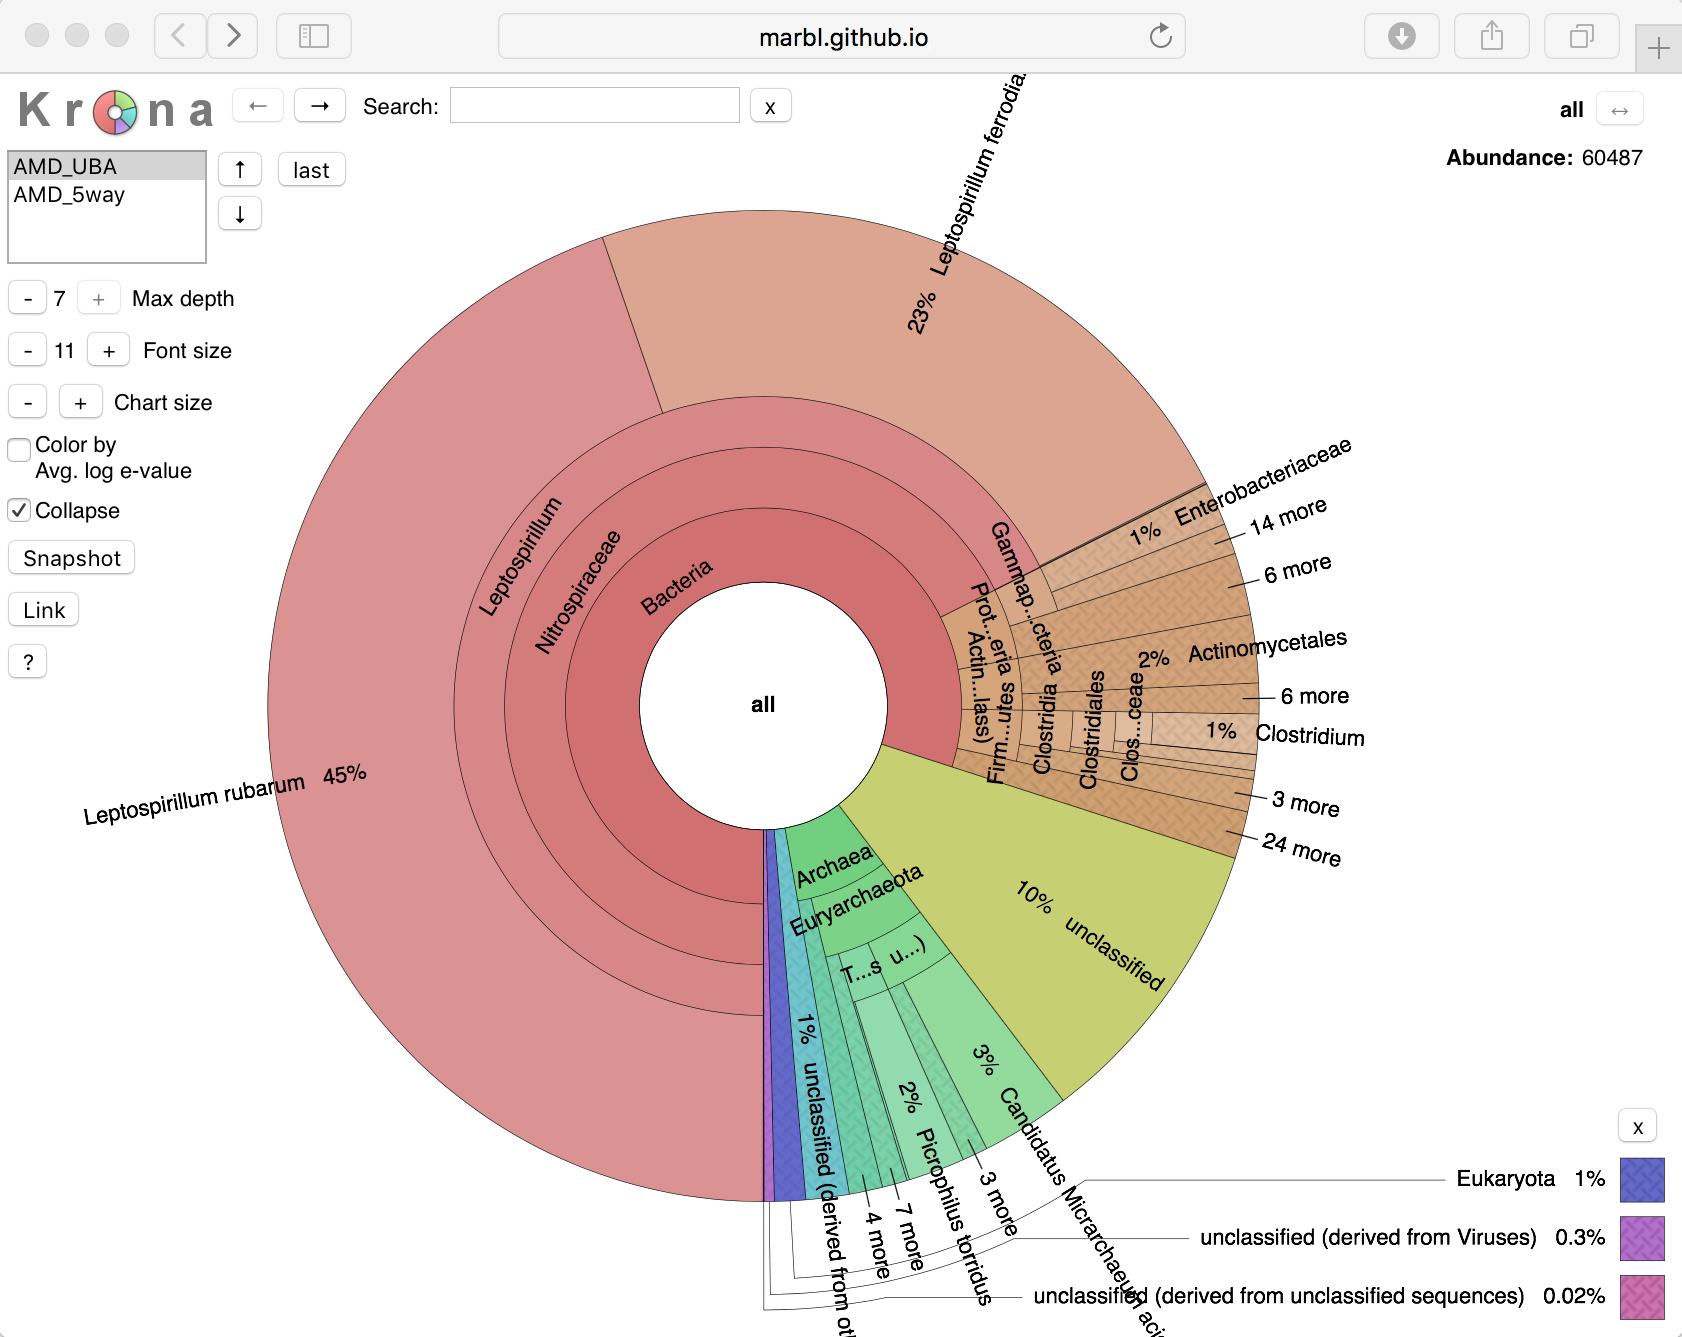
- MG-RAST classification of acid mine drainage biofilm metagenomes [Tyson et al.]
-
RDP classification of 16s reads from Moving pictures of the human microbiome [Caporaso et al.]

- PhyloSift - phylogeny-driven metagenomic classification and comparision
- metAMOS - metagenomic assembly and classification pipeline
- MGTAXA - metagenomic classification server
- Metavir - viral metagenomic annotation server
- PhymmBL - metagenomic classification
- MG-RAST - metagenomics analysis server
- BacDive - bacterial isolation source search
- Prophane - metaproteomics analysis pipeline
-
Animation
- Krona uses HTML5 to create animated transitions when zooming in and out.
-
Portability
- Krona charts are explored with web browsers, so no installation is necessary to view them.
- Since Krona charts use HTML5, they will work without plugins using any modern browser and on any operating system.
- Each Krona chart is contained in a single file, making them easy to share.
-
Flexibility
- Krona can create charts from XML, and charts can contain custom HTML with links to other pages. This allows straightforward integration with custom applications.
- The use of web technologies makes it easy to include Krona charts in existing web pages.
- Krona can render SVG snapshots for printing or publication.