Student name: Marco Fijan
The Volkskrant asked me to give interesting insights about 'the car in the city' for a potential interesting article. It's my job to research the RDW datasets for interesting insights. The Volkskrant will write an article about it if I find something interesting. As a tip, the Volkskrant gave me the link to the RDW datasets, but I am free to chose and use other datasets as well.
This repository has been seperated into multimple projects.
This is a project where I tried several things with data and d3.
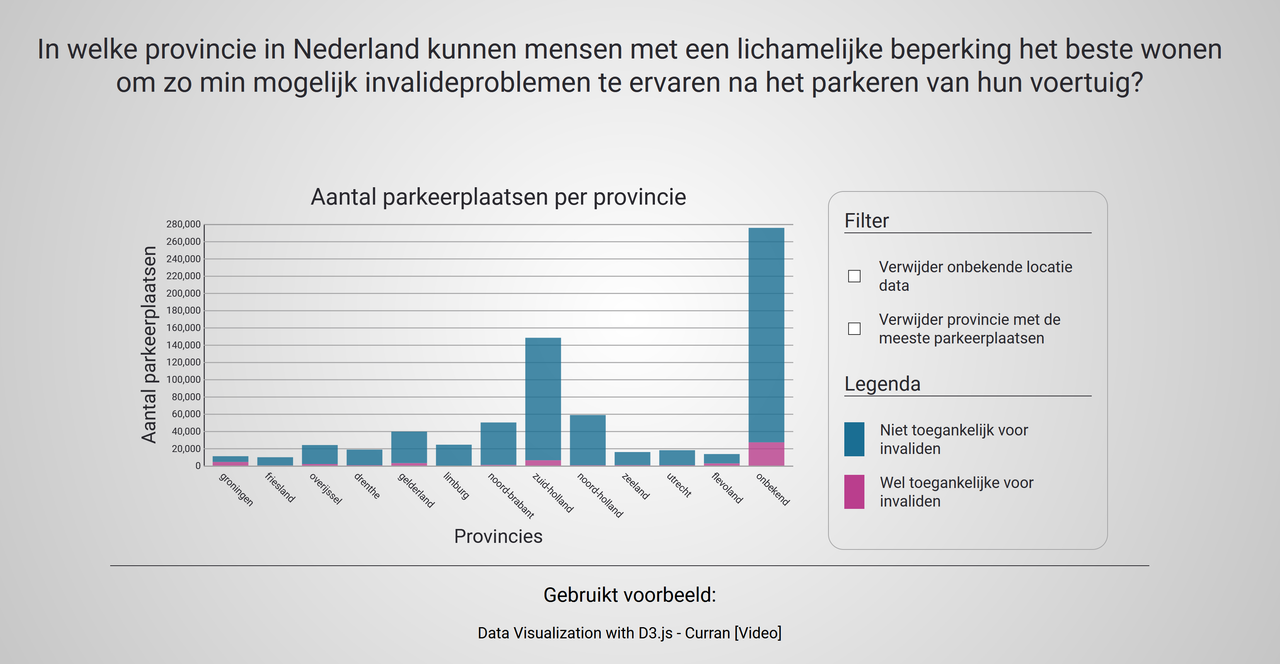
I received a big dataset from an API and saved that onto a smaller file with specific data needed for my concept. I also cleaned up the data that I received. The dataset was pretty messy so it needed some cleaning when the data was missing. Besides receiving and cleaning the data, I also visualized the data with d3. Here I made a stacked bar chart which shows how many parkingspots are availible for people with a phisical limitation. I seperate those parkingspots with provinces.
This project has 2 different side-projects: EnqueteData & RDWData.
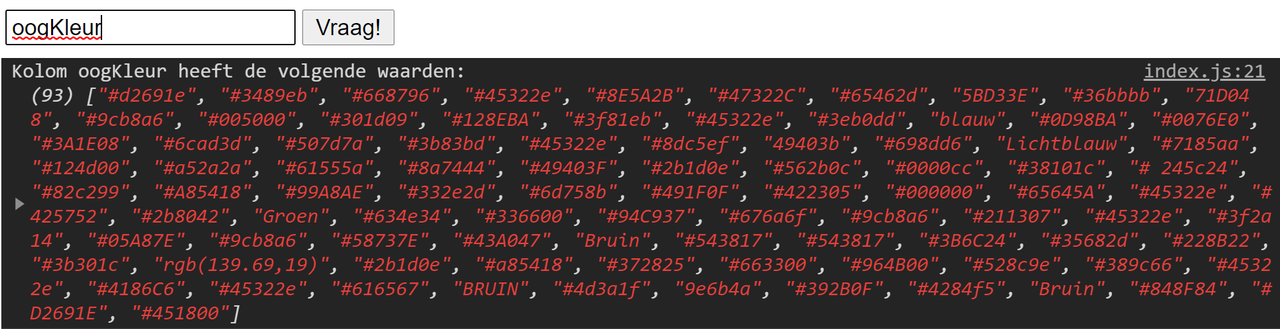
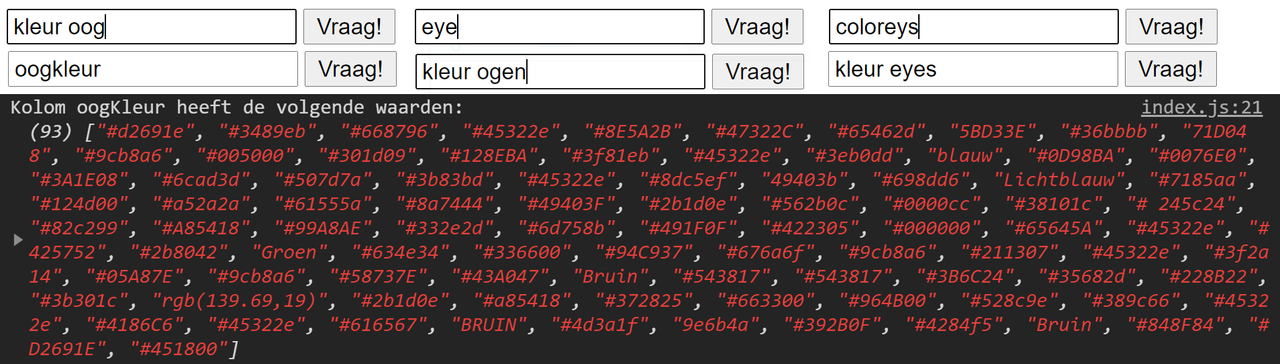
In EnqueteData I am writing a simple project where I gather the data from a dataset from a json file. The user can receive certain columns from the dataset by using the textbox on the HTMLpage. After the user typed his or her query, the program will then check if the user typed a valid input. If the input is valid, the program will try to 'clean' the data. Empty values, wrong format values and whitespaces will be fixed. If the program is unable to fix a certain value, the program will return a warning but continue with the other values. That way the user will still receive his or her preferred column. For more information about the development of this project, navigate to my wiki
I am writing a simple project where I am practising with receiving data from an api. I'm using the same html and textinput from my previous project in this repo. I will try to collect specific columns and clean them. Besides that I will compare columns with eachother to find interesting data. For the data I will be using different api's from RDW. I want to find answers for my main question
I'm planning to make an interactive parkingarea that will visualize per city how many parkingspots are availible for people with a phisical limitation
This was just the beginning of cleaning the RDW-data. Please navigate to my Frontend Data section in the repo.
I want to visualize the accessibility with percentages of availible parking spaces. I want to use a parkingarea and color these according to their accessibility:
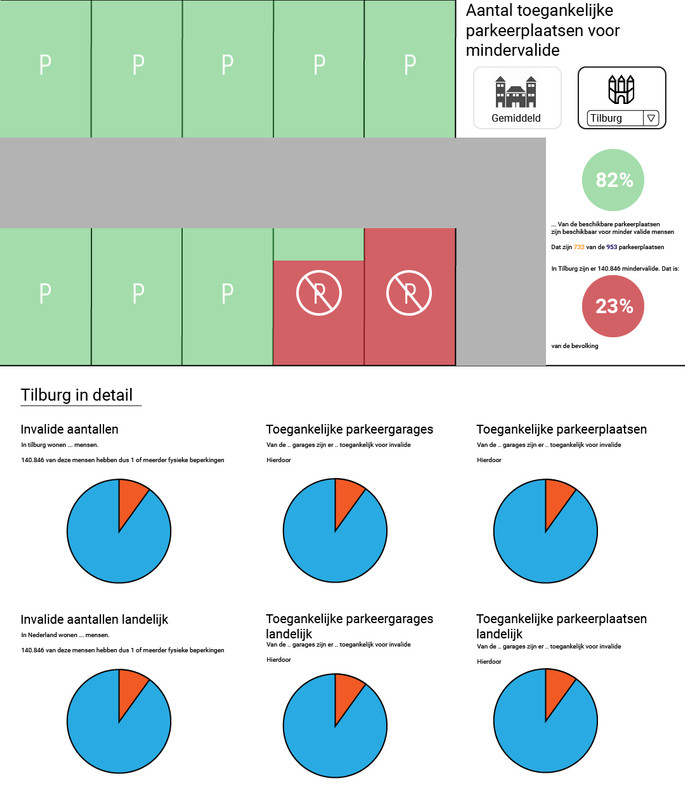
The green parking spots are parking areas in percentage that are accessible for phisical handicapped people. The red parking areas is the amount of percentage of parking areas not accessible for phisical handicapped people. The user can sort the data by location on the right side of the screen. Below the visualisation the user can dive deeper into the data.
According to this dataset from the Central Bureau of Statistics of the Netherlands, a lot of citizenry have one or more phisical limitation. More then 13% has a phisical limitation. Still, according to the RDWDataset, most parkinggarages are not accessible for those citizenry. I want to research how many parkingspots are availible per province, and how many are required in percentage according to the numbers of the Central Bureau of Statistics.
Which province in the Netherlands is the best province to live for people with a phisical limitation when you look at the accessibility of parkingspots?
- What is the ratio of the overall capacity and availible parking spaces for people with a disability per province?
- What is the ratio of the total number of parking garages and accessible parking garages for people with a disability per province?
- What is the percentage of people with a physical disability per province?
This is the data I used per project:
Before I can visualize my concept, I need to collect the data that I need:
I wanted to collect my data from different RDWDatasets. Unfortunatly, many datasets were incomplete or couldn't be linked together. So I chose for the big RDWDataset where all data could be fetched.
From the dataset I need the following data:
- DisabledAccess: boolean which shows if parking garage is accessible for people with a phisical handicap
- Capacity: integer that gives the amount of parkingspots of that garage
- Province: string that gives the province where the parking garage is located
To read how I received and saved the data, please navigate to receiving the data wiki where I go into detail on how I collected and saved that data.
For this project I am using a dataset of an enquëte from Datavisualisatie 2. This dataset contains several interesting insights about CMD-students. This dataset has been created by Jan-Jaap Rijpkema and converted into json by Jonah Meijers. The data for this dataset has been collected in September from CMD-students who are in the beginning of their third year.
For this project I used the following data:
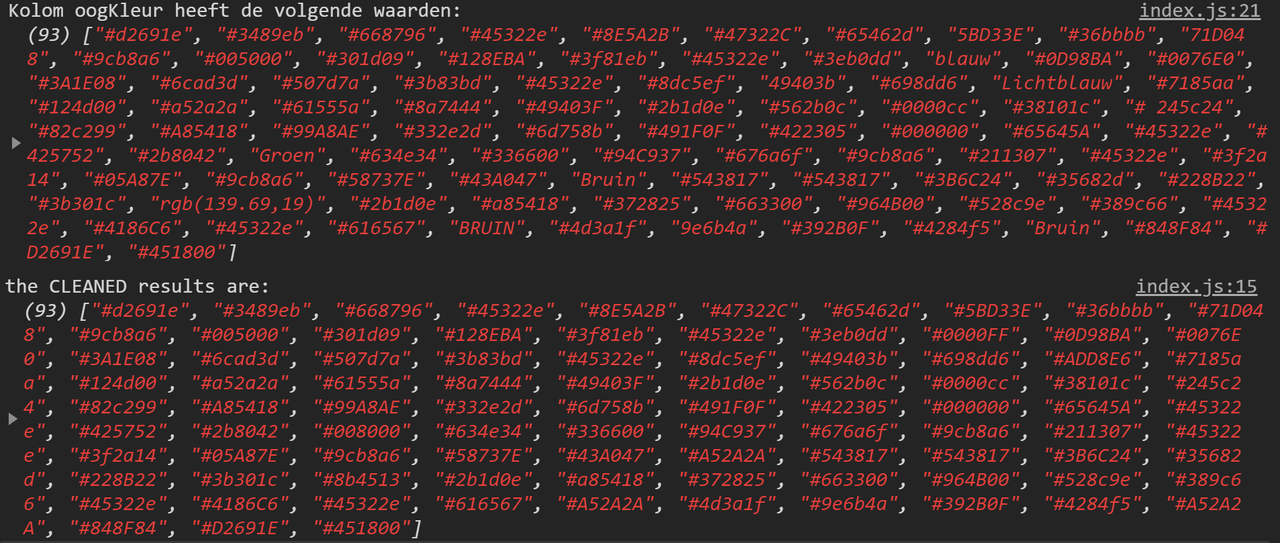
- oogKleur: string that should give a hex-colorcode
Aw of now, the only data used in this project is one api from RDW with specific data of parkingarea's (capacity, maximum height, maximum weight etc...) RDWData: Parking Specifications API
In this project I used the following datacolumns for testing, but all columns can be used:
- capacity: integer that gives the capacity of the parking area
- disabledAccess: boolean about the accessibility of the parking garage for people with a phisical handicap
As of now, this project has the following features:
- A big datacollection will be collected from here in combination with the corseverywhere herokuapp to access the data from my localhost
- That datacollection will be filtered with only the needed data for my visualisation and be resaved as a new file
- That file will be hosted on a new location
- The new data will be cleaned (all undefined values will be edited in to usable data)
- The new data will be saved in an array and given to the Chart
- The chart will be visualized with the power of d3
- The chart will show a stacked barchart
- The barchart will show the amount of accessible parkingspots for people with a phisical handicap
- The barchart will also show the amount of inaccessible parkingspots for people with a phisical handicap
As of now, this project has the following features:
- User can give input on which column he or she wants to see in the console
- UserInput will be checked and converted to a valid input if possible
- The column 'oogKleur' will be coverted and cleaned into usable data
As of now, this project has the following features:
- Project will make a connection to an api from RDW
- User can give input on which column he or she wants to see in the console
- For to basics of getAllRDWData.json I used the example of Laurens Aarnoudse
const proxyUrl = 'https://cors-anywhere.herokuapp.com/'
const overviewUrl = 'https://npropendata.rdw.nl/parkingdata/v2/'

//#####################################################

const allParkingFacilities = await getData(proxyUrl+overviewUrl)
const preparedData = await prepareData(allParkingFacilities, settings.remoteParkingsAmount)
//This step is only useful while exploring the data and shouldn't be in production code
inspectData(preparedData)

//#####################################################

async function getData(url){
  let data = await d3.json(url)
  return data
}- For the basic d3 barchart I used the example of curran
const svg = d3.select('svg')
const margin = { left: 70, right: 20, bottom: 100, top: 50 }
const innerWidth = width - margin.left - margin.right
const innerHeight = height - margin.top - margin.bottom

// #############################################

const yAxis = d3.axisLeft(scaleY)
  .tickSize(-innerWidth)

const xAxis = d3.axisBottom(scaleX)

const yAxisGroup = g.append('g')
  .call(yAxis)
  .attr('class', 'yAxis')

yAxisGroup.select('.domain').remove()

yAxisGroup.append('text')
  .attr('y', -50)
  .attr('x', -(innerHeight / 2))
  .attr('transform', 'rotate(-90)')
  .attr('class', 'yAxisName')
  .text('Aantal parkeerplaatsen')

const xAxisGroup = g.append('g').call(xAxis)
  .attr('transform', 'translate(0,' + innerHeight + ')')
  .attr('class', 'xAxis')

xAxisGroup.selectAll('text')
  .attr('transform', 'rotate(45)')

xAxisGroup.selectAll('.domain, .tick line').remove()

xAxisGroup.append('text')
  .attr('y', 80)
  .attr('x', innerWidth / 2)
  .attr('class', 'xAxisName')
  .text('Provincies')

g.append('text')
  .text('Aantal parkeerplaatsen per provincie')
  .attr('y', -20)
  .attr('x', innerWidth / 2)
  .attr('class', 'title')
}- To understand how stack worked in d3, I used the example of the Muratorium
g.selectAll('.layer').data(valueY)
  .enter().append('g')
  .attr('class', 'layer')
  .attr("fill", d => colorScale(d.key))
  .selectAll('rect').data(d => d)
    .enter().append('rect')
      .attr('x', d => scaleX(d.data.province))
      .attr('y', d => scaleY(d[1]))
      .attr('width', scaleX.bandwidth())
      .attr("height", 0) // set height 0 for the transition
      .transition().duration(800)
.attr('height', d => scaleY(d[0]) - scaleY(d[1]))- To understand how the update function exactly works I used the example of Laurens Aarnoudse
bars
  .attr('x', d => x(d.description))
  .attr('y', d => y(d.capacity))
  .attr('width', x.bandwidth())
.attr('height', d => height - y(d.capacity))To try this project for yourself, you can clone the github repo to your locale machine. Just follow these steps
Navigate with your terminal to the desired folder where you want to clone this repo
cd "c:/foldername1/foldername2/destination"
Optional Use this command to create a new folder where you want to clone this repo.
mkdir "foldername"
Optional Don't forget to navigate to that folder with using the cd command
Optional If you desire to make changes to this project run this command to make that possible
git init
To clone this project and receive it on your locale machine, use this command
git clone https://github.com/marcoFijan/frontend-data.git
After this command your computer will download the files automaticly
Navigate to the folder where you cloned the git repository and launch the index.html
To see your results, you need to look in the console Right-click on the webpage and click 'inspect' or 'inspect element' Then, click on the tab called 'console'
That's it. You are all set up!
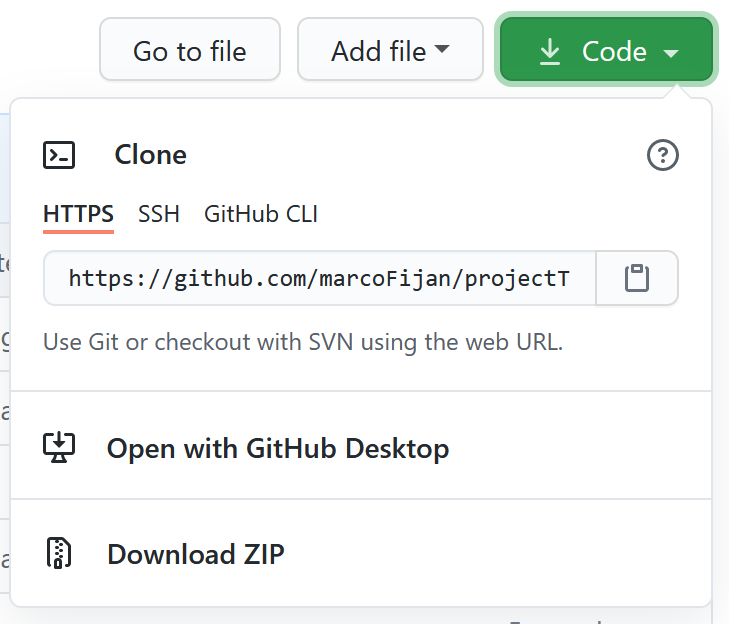
Navigate to the code on Github and press the 'code' button. After pressing the 'code' button select 'download as zip'
After downloading the files navigate to a folder of your choice and copy the files from the zip folder to that folder.
Navigate to that folder where you put the files and launch the index.html
To see your results, you need to look in the console Right-click on the webpage and click 'inspect' or 'inspect element' Then, click on the tab called 'console'
That's it. You are all set up!
- All the studens from the data visualisation track who filled in the enquete
- Jan-Jaap Rijpkema for collecting the dataset
- Jonah Meijers for converting the dataset to .json
- Rijk van Zanten for explaining how to connect multiple datasets with eachother
- Laurens Aarnoudse for explaining how to avoid the CORS error
- The Muratorium for explaining stack in d3
- Curan for the amazing explanation of D3
- Laurens Aarnoudse for the live code demo's and explaining functional programming
- Chelsea Doeleman for tips on how to make better functional programming functions
- RDW for collecting and documenting the dataset
- The Volkskrant for giving tips and feedback
- stackoverflow for multiple difficult code (see index.js for the sources)