Skip to content
New issue

Have a question about this project? Sign up for a free GitHub account to open an issue and contact its maintainers and the community.

By clicking “Sign up for GitHub”, you agree to our terms of service and privacy statement. We’ll occasionally send you account related emails.

Already on GitHub? Sign in to your account

savefig PDF output - incorrect annotation location #10844

Closed
delorytheape opened this issue Mar 20, 2018 · 9 comments
Closed

savefig PDF output - incorrect annotation location #10844

delorytheape opened this issue Mar 20, 2018 · 9 comments

Comments

@delorytheape
Copy link

Bug report

Annotation beneath legend is positioned correctly on screen and with PNG output generated by savefig(). Annotation location is incorrect for PDF output of savefig()

Code for reproduction

import matplotlib.pyplot as plt
import matplotlib.text

fig, ax = plt.subplots()

ax.plot([5,1], label="Label 1")
ax.plot([3,0], label="Label 2")

legend = ax.legend(loc="upper right")

# Create offset from lower right corner of legend box,
# (1.0,0) is the coordinates of the offset point in the legend coordinate system
offset = matplotlib.text.OffsetFrom(legend, (1.0, 0.0))
# Create annotation. Top right corner located -20 pixels below the offset point 
# (lower right corner of legend).
ax.annotate("info_string", xy=(0,0),size=14,
            xycoords='figure fraction', xytext=(0,-20), textcoords=offset, 
            horizontalalignment='right', verticalalignment='top')
# Draw the canvas for offset to take effect
fig.canvas.draw()

fig.savefig('plot1.png')
fig.savefig('plot1.pdf')

plt.show()

Actual outcome

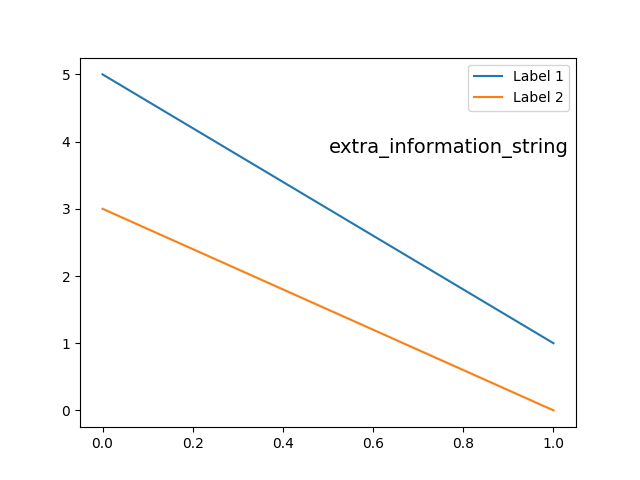
The code produces an on-screen plot with two lines, a legend, and the annotation string 'info_string' located beneath the legend and aligned to the right hand edge of the legend box.
The code also generates two files;

  1. 'plot1.png', which is generated correctly
  2. 'plot1.pdf', which is generated incorrectly. The annotation is not visible, as it is in the wrong location (far right of the displayed region).

The PNG output is here, which is what both files should look like.
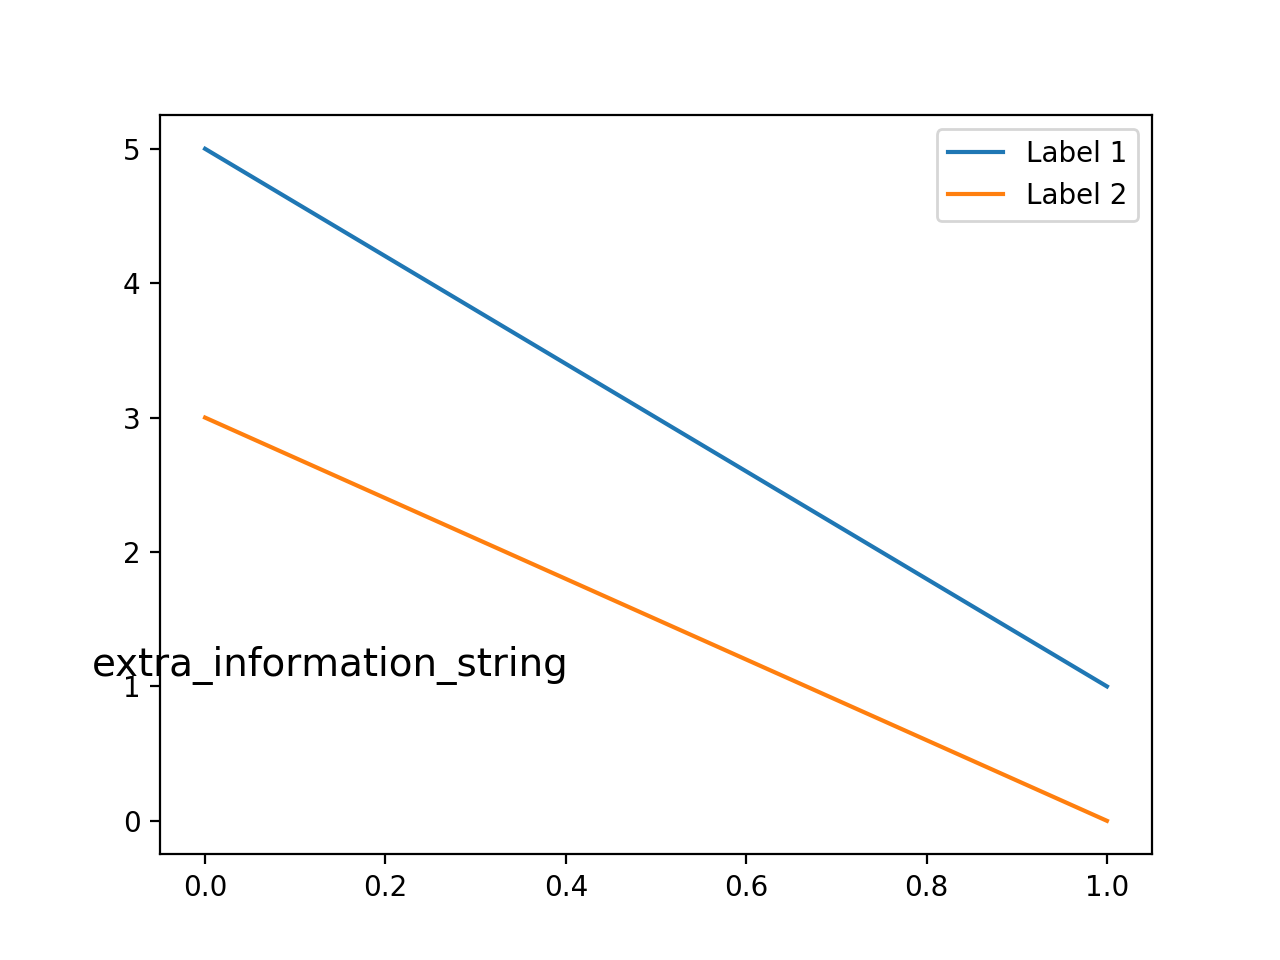
The incorrect PDF output is here.

If the length of the annotation string in increased (eg. to 'extra_information_string'), the first few characters become visible in the top right corner of the PDF file.

Expected outcome
The PDF file should show the annotation in the same location as the on screen plot and the PNG file.

Software Versions

  • Operating system: Windows 7 Home
  • Matplotlib version: 2.2.0 (problem also appears with 1.5.3)
  • Matplotlib backend (print(matplotlib.get_backend())): Qt5Agg
  • Python version: 2.7.14
  • Jupyter version (if applicable): N/A
    Matplotlib and python were installed using conda from the default channel.
    The problem was observed when running the above code as a script from the command line.
@delorytheape
Copy link
Author

Thanks for cross referencing this for me IOBE. I have not submitted a bug report before...

@QuLogic
Copy link
Member

QuLogic commented Mar 20, 2018

This is because the offset you get is with the default DPI, but PDF always uses 72. You can workaround it by explicitly setting the DPI with plt.subplots(dpi=72), though you end up with a slightly smaller PNG and interactive plot.

The correct fix is to somehow get OffsetFrom and/or annotate to use the right renderer, but I'm not sure how difficult that is.

@afvincent
Copy link
Contributor

afvincent commented Mar 20, 2018

Well, 👍 that something is wrong with how DPI value is handled. Even the PNG outputs can become weird, see for example (with the snippet from above):

for dpi in (100, 200, 300):
    fig.savefig('plot1_{}.png'.format(dpi), dpi=dpi)
  • 100 dpi-PNG (default, is it not?) plot1_100
  • 200 dpi-PNG plot1_200
  • 300 dpi-PNG plot1_300

@efiring
Copy link
Member

efiring commented Mar 20, 2018

Based on a quick look at the code, I don't see where the problem is coming from. It looks like everything is being updated with every draw, using the renderer in effect at draw-time.

@tacaswell tacaswell added this to the v3.0 milestone Mar 21, 2018
@jklymak
Copy link
Member

jklymak commented Mar 28, 2018

Its definitely a dpi issue. If I change the x,y by renderer.dpi / 200 I get the right positioning. However, I have no way to programatically get the 200 from within text.OffsetFrom. self._artist.figure.dpi returns the same as renderer.dpi at this point. But when it calls self._artist.get_window_extent(renderer), it gets co-oridnates at 200 dpi. (It ignores the renderer argument, as do most artists for whatever reason). I can't see a good way of guessing the original figure dpi from within text.OffsetFrom, but its late so maybe I'm being dumb.

@jklymak
Copy link
Member

jklymak commented Mar 28, 2018

#10910 fixes this, hopefully in a way that doesn't break anything else...

@tacaswell tacaswell modified the milestones: v3.0, v3.1 Aug 11, 2018
@tacaswell tacaswell modified the milestones: v3.1.0, v3.2.0 Mar 18, 2019
@dstansby
Copy link
Member

Closing, since #10910 is merged. Feel free to re-open or comment if this is still an issue.

@tacaswell tacaswell removed this from the v3.2.0 milestone Apr 22, 2019
@tacaswell
Copy link
Member

tacaswell commented Apr 22, 2019

cleared the milestone as this was actually fixed in 3.0

Sign up for free to join this conversation on GitHub. Already have an account? Sign in to comment
Labels
None yet
Projects
None yet
Development

No branches or pull requests

8 participants