Skip to content
New issue

Have a question about this project? Sign up for a free GitHub account to open an issue and contact its maintainers and the community.

By clicking “Sign up for GitHub”, you agree to our terms of service and privacy statement. We’ll occasionally send you account related emails.

Already on GitHub? Sign in to your account

colorbar(boundaries=...) doesn't work so well with nonlinear norms #12312

Open
anntzer opened this issue Sep 27, 2018 · 7 comments
Open

colorbar(boundaries=...) doesn't work so well with nonlinear norms #12312

anntzer opened this issue Sep 27, 2018 · 7 comments

Comments

@anntzer
Copy link
Contributor

anntzer commented Sep 27, 2018

Bug report

Bug summary

Code for reproduction

from pylab import *
imshow(np.random.rand(100, 100), norm=mpl.colors.LogNorm())
colorbar(boundaries=[1e-4, 1e-3, 1e-2, 1])

Actual outcome

test

Expected outcome

Either properly positioned boundaries, or (better) disallow passing boundaries in such cases.

Note that the docstrings in colorbar.py say

    The following will probably be useful only in the context of
    indexed colors (that is, when the mappable has norm=NoNorm()),
    or other unusual circumstances.

    ============   ===================================================
    Property       Description
    ============   ===================================================
    *boundaries*   None or a sequence
    *values*       None or a sequence which must be of length 1 less
                   than the sequence of *boundaries*. For each region
                   delimited by adjacent entries in *boundaries*, the
                   color mapped to the corresponding value in values
                   will be used.
    ============   ===================================================

but that still ends up part of the public API, which makes my intended fix for #7320 more difficult...

Matplotlib version

  • Operating system: linux
  • Matplotlib version: master
  • Matplotlib backend (print(matplotlib.get_backend())): qt5agg
  • Python version: 3.7
  • Jupyter version (if applicable):
  • Other libraries:
@ImportanceOfBeingErnest
Copy link
Member

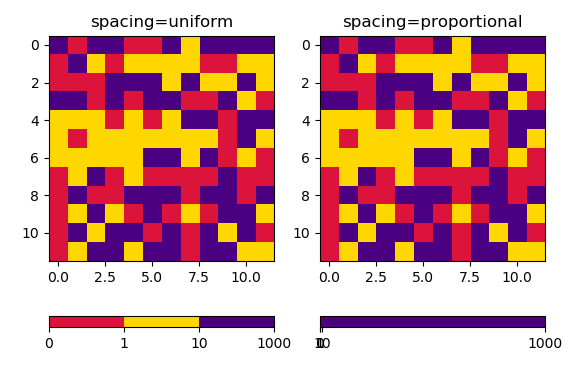
You get "properly" positionned ticks when in addition specfiying spacing="proportional".

import matplotlib.pyplot as plt
import matplotlib.colors
import numpy as np

plt.imshow(np.random.rand(100, 100), norm=matplotlib.colors.LogNorm())
plt.colorbar(boundaries=[1e-4, 1e-3, 1e-2, 1], spacing="proportional")

plt.show()

image

@anntzer
Copy link
Contributor Author

anntzer commented Sep 27, 2018

Thanks for pointing this out. I don't think this should be an option, though... (it sound be the default and only behavior... no?)

@jklymak
Copy link
Member

jklymak commented Sep 27, 2018

When overhauling colorbar I didn’t really look at boundary colorbars. Maybe they need a similar overhaul

@jklymak
Copy link
Member

jklymak commented Sep 27, 2018

Oops. Didn’t see the above. I’d be in favour of proportional=true as a default.

@ImportanceOfBeingErnest
Copy link
Member

I would have though the "usual" (if you can speak of "usual" for something that declared "unusual") use case would be something like

import matplotlib.pyplot as plt
import matplotlib.colors
import numpy as np; np.random.seed(42)

data = np.random.choice([0,5,250], size=(12,12))
cmap = matplotlib.colors.ListedColormap(["crimson","gold","indigo"])
bounds = [0,1,10,1000]
norm = matplotlib.colors.BoundaryNorm(bounds, len(bounds)-1)

fig, axes = plt.subplots(ncols=2)

for ax, spacing in zip(axes, ["uniform", "proportional"]):

    ax.set_title("spacing="+spacing)
    im = ax.imshow(data, norm=norm, cmap=cmap)
    fig.colorbar(im, ax=ax, boundaries=bounds, values =[0,5,250], spacing=spacing, 
                 orientation="horizontal")

plt.show()

image

Here the use of "proportional" is clearly undesired.

The consequence of such change is then the usual "My plot looks different, what can I do?". Hence my vote here would be: Don't break the API.

@anntzer
Copy link
Contributor Author

anntzer commented Sep 28, 2018

As the docstring quote above says:

    The following will probably be useful only in the context of
    indexed colors (that is, when the mappable has norm=NoNorm()),
    or other unusual circumstances.

I guess we can add BoundaryNorm to the list of reasonable use cases. But it would be nice if NoNorm and BoundaryNorm could somehow signal that they need this behavior to the colorbar machinery, rather than the user having to specify it.

@github-actions
Copy link

This issue has been marked "inactive" because it has been 365 days since the last comment. If this issue is still present in recent Matplotlib releases, or the feature request is still wanted, please leave a comment and this label will be removed. If there are no updates in another 30 days, this issue will be automatically closed, but you are free to re-open or create a new issue if needed. We value issue reports, and this procedure is meant to help us resurface and prioritize issues that have not been addressed yet, not make them disappear. Thanks for your help!

@github-actions github-actions bot added the status: inactive Marked by the “Stale” Github Action label May 18, 2023
@story645 story645 removed the status: inactive Marked by the “Stale” Github Action label May 18, 2023
Sign up for free to join this conversation on GitHub. Already have an account? Sign in to comment
Projects
None yet
Development

No branches or pull requests

5 participants