Multi-line ticks cause cut-offs #15576
Comments
|
The last answer in the stack overflow link looks like it should work for you. If things are being clipped you will have to make more room between the bottom of the axes and the bottom of the figure. |
|
@jklymak are you refering to https://stackoverflow.com/a/53942830? I already use multi-line ticks. The problem is that the labels get cut off weirdly as in the screenshots. The first line in the first screenshot should perfeclty match the first line of the second screenshot and this is not the case. |
|
Hard to know why w/o some code duplicating the problem... |
|
I know :( I'll try to provide a MWE, meanwhile the stackoverflow question may be hitting the same issue: labels getting cut off when using mutli-line labels |
|
does #14705 help? |
|
@anntzer Yes! It does help! I wonder if it also solves the stackoverflow MWE with labels in Chinese. |
|
Yes, it does. |
|
Is the fix for this available in 3.2.0rc2? I've installed it from |
|
version 3.1.0 with that fix applied manually worked fine if I remember well |
UPD #14705 fixes this issue
Unfortunately I can't provide a full MWE at this moment (I'll try to find time and update with code), but I thought reporting will still be good anyway.
I want to use cyrillic text ticks in order to debug a speech recognition system. I plot either the top-1 character prediction or top-2. I use mutli-line ticks in order to plot two character predictions. In top-2 mode the labels get cut off, including the label that's on the first line.
When top-1 prediction is plotted:
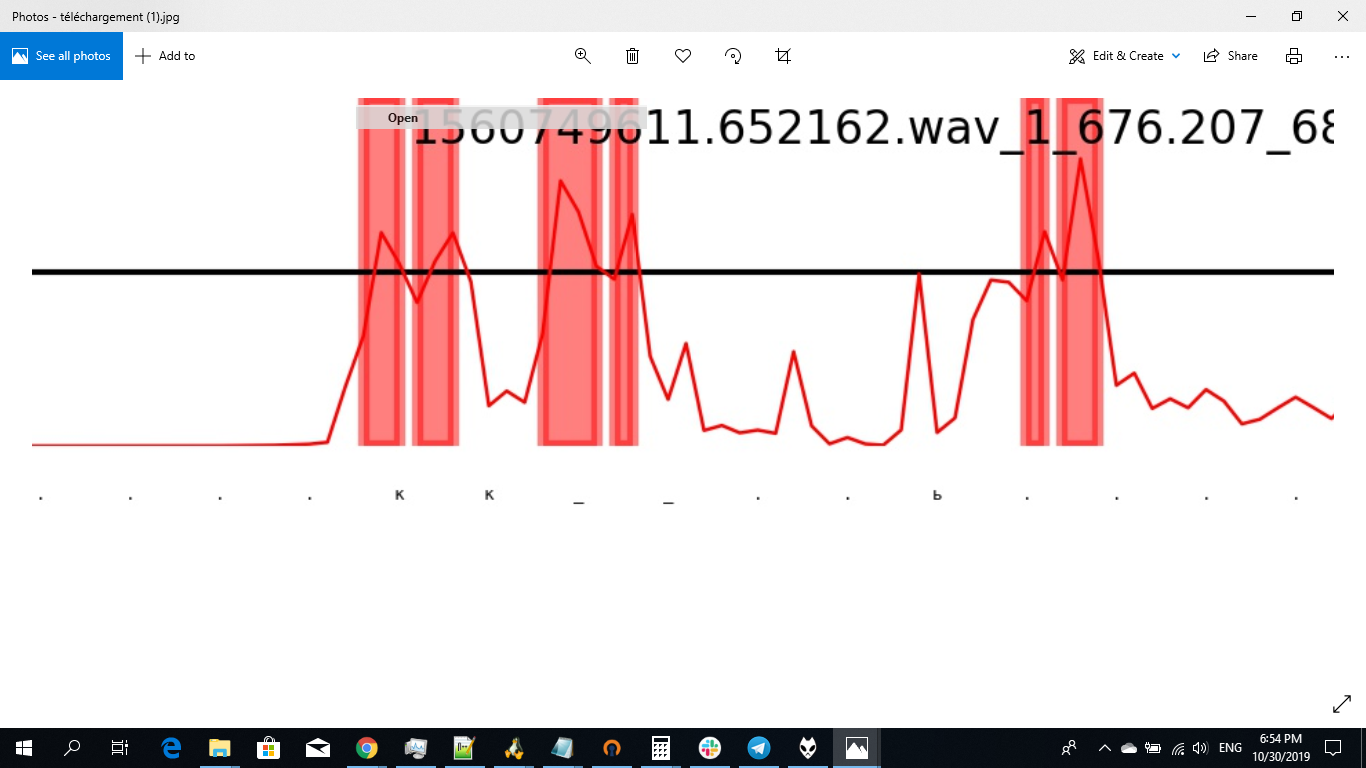
When top-2 predictions are plotted (note the cut-off labels).

The labels are not affected by any randomness, the only difference is using ticks of 1 character or 3 characters (counting the newline character). Essentially I'd use an appropriate
rotationmode if it existed.Potentially related issue with a MWE: https://stackoverflow.com/questions/53942480/how-can-i-change-the-text-direction-of-tick-labels-in-matplotlib
The text was updated successfully, but these errors were encountered: