xlim_changed not emitted on shared axis #15785
Comments
|
I'm also seeing this behavior on matplotlib 3.4.1. Working from the resampling data example, I've been developing an adaptive waveform plotter in this PR (code included there). The specific quirks that I'm seeing are as follows:
Note: if I create the shared axes, draw on |
|
A short self-contained example would be very helpful here! Thanks |
|
"short" is relative here :) There is a full setup in the linked PR, but here's something hopefully a little more streamlined: import numpy as np
import matplotlib.pyplot as plt
# From https://matplotlib.org/stable/gallery/event_handling/resample.html
# A class that will downsample the data and recompute when zoomed.
class DataDisplayDownsampler:
def __init__(self, xdata, ydata):
self.origYData = ydata
self.origXData = xdata
self.max_points = 50
self.delta = xdata[-1] - xdata[0]
def downsample(self, xstart, xend):
# get the points in the view range
mask = (self.origXData > xstart) & (self.origXData < xend)
# dilate the mask by one to catch the points just outside
# of the view range to not truncate the line
mask = np.convolve([1, 1, 1], mask, mode='same').astype(bool)
# sort out how many points to drop
ratio = max(np.sum(mask) // self.max_points, 1)
# mask data
xdata = self.origXData[mask]
ydata = self.origYData[mask]
# downsample data
xdata = xdata[::ratio]
ydata = ydata[::ratio]
print("using {} of {} visible points".format(len(ydata), np.sum(mask)))
return xdata, ydata
def update(self, ax):
# Update the line
lims = ax.viewLim
if abs(lims.width - self.delta) > 1e-8:
self.delta = lims.width
xstart, xend = lims.intervalx
self.line.set_data(*self.downsample(xstart, xend))
ax.figure.canvas.draw_idle()
# Create a signal
xdata = np.linspace(16, 365, (365-16)*4)
ydata = np.sin(2*np.pi*xdata/153) + np.cos(2*np.pi*xdata/127)
# --- This does not work: ax1 drawn after ax0 kills callbacks
d = DataDisplayDownsampler(xdata, ydata)
fig, (ax0, ax1) = plt.subplots(nrows=2, sharex=True)
# Hook up the line
d.line, = ax0.plot(xdata, ydata, 'o-')
ax0.set_autoscale_on(False) # Otherwise, infinite loop
# Connect for changing the view limits
ax0.callbacks.connect('xlim_changed', d.update)
ax0.set_xlim(16, 365)
ax1.plot(xdata, -ydata)
plt.show()
# --- This does work: ax0 drawn after ax1
# --- Note: only works if axis limits are controlled via ax0, not ax1
# Create a signal
xdata = np.linspace(16, 365, (365-16)*4)
ydata = np.sin(2*np.pi*xdata/153) + np.cos(2*np.pi*xdata/127)
d = DataDisplayDownsampler(xdata, ydata)
fig, (ax0, ax1) = plt.subplots(nrows=2, sharex=True)
ax1.plot(xdata, -ydata)
# Hook up the line
d.line, = ax0.plot(xdata, ydata, 'o-')
ax0.set_autoscale_on(False) # Otherwise, infinite loop
# Connect for changing the view limits
ax0.callbacks.connect('xlim_changed', d.update)
ax0.set_xlim(16, 365)
plt.show()In neither case does panning/zooming/setting limits on |
|
Thats not bad ;-) |
|
The problem is that we do which doesn't do the If we don't do this, it continues to emit to the shared axes and we get an infinite recursion. Something like diff --git a/lib/matplotlib/axes/_base.py b/lib/matplotlib/axes/_base.py
index 9898c7c75..0c1941efb 100644
--- a/lib/matplotlib/axes/_base.py
+++ b/lib/matplotlib/axes/_base.py
@@ -3742,10 +3742,11 @@ class _AxesBase(martist.Artist):
# Call all of the other x-axes that are shared with this one
for other in self._shared_x_axes.get_siblings(self):
if other is not self:
- other.set_xlim(self.viewLim.intervalx,
- emit=False, auto=auto)
- if other.figure != self.figure:
- other.figure.canvas.draw_idle()
+ if not np.allclose(other.viewLim.intervalx, self.viewLim.intervalx):
+ other.set_xlim(self.viewLim.intervalx,
+ emit=True, auto=auto)
+ if other.figure != self.figure:
+ other.figure.canvas.draw_idle()Fixes the problem (plus we'd need the same for yaxis). However, I'm not really expert enough on how sharing is supposed to work versus the callbacks to know if this is right or the best. @anntzer or @efiring last touched this part of the code I think. |
|
I think I would prefer something like diff --git i/lib/matplotlib/axes/_base.py w/lib/matplotlib/axes/_base.py
index 9898c7c75..1116d120f 100644
--- i/lib/matplotlib/axes/_base.py
+++ w/lib/matplotlib/axes/_base.py
@@ -541,6 +541,11 @@ class _process_plot_var_args:
return [l[0] for l in result]
+import dataclasses
+_NoRecursionMarker = dataclasses.make_dataclass(
+ "_NoRecursionMarker", ["event_src"])
+
+
@cbook._define_aliases({"facecolor": ["fc"]})
class _AxesBase(martist.Artist):
name = "rectilinear"
@@ -3737,13 +3742,18 @@ class _AxesBase(martist.Artist):
if auto is not None:
self._autoscaleXon = bool(auto)
- if emit:
+ if emit and emit != _NoRecursionMarker(self):
self.callbacks.process('xlim_changed', self)
# Call all of the other x-axes that are shared with this one
for other in self._shared_x_axes.get_siblings(self):
if other is not self:
+ # Undocumented internal feature: emit can be set to
+ # _NoRecursionMarker(self) which is treated as True, but
+ # avoids infinite recursion.
+ if not isinstance(emit, _NoRecursionMarker):
+ emit = _NoRecursionMarker(self)
other.set_xlim(self.viewLim.intervalx,
- emit=False, auto=auto)
+ emit=emit, auto=auto)
if other.figure != self.figure:
other.figure.canvas.draw_idle()
self.stale = Trueto more explicitly block infinite recursion, but other than that the basic idea seems fine to me. |
|
I'm not sure if this is related, but I'm seeing a similar issue if I try to run the same example code multiple times on one ax. As far as I can tell from reading https://github.com/matplotlib/matplotlib/blob/master/lib/matplotlib/cbook/__init__.py , it should support multiple callbacks on the same signal (or am I misunderstanding?), but the above example when run twice only issues the second callback. If you think this is unrelated, I can open a separate issue for it. |
|
I'm not exactly sure what you mean, but note that CallbackRegistry currently drops duplicate callbacks (connecting a same callback a second time to the same signal results in it being dropped and the original cid is returned). I actually think that's a pretty unhelpful behavior and would be happy to see it deprecated (that can just go through a normal deprecation cycle), but that would be a separate issue. |
|
Ah, I see. Thanks @anntzer for the clarification. |
|
I am 👍 on @anntzer 's solution here. Marking this as a good first issue because we have a patch for it. Will still need to write a test, a simplified version of the initial bug report would probably work (we do not need convolve in the tests / real signals etc). also good to see fellow NYers around! |
|
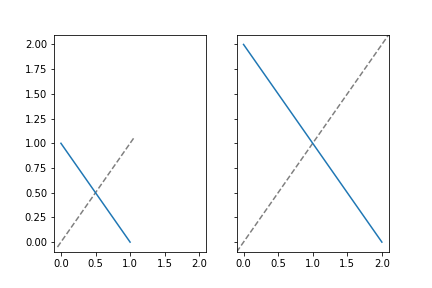
Having the same problem with perhaps a somewhat simpler example. If the registered callbacks were triggered by changes in axes limits from plots with shared x/y-axes, the gray dashed line in the left plot would extend across the whole canvas:
from typing import Any

import matplotlib.pyplot as plt
from matplotlib.axes import Axes


def add_identity(ax: Axes = None, **line_kwargs: Any) -> None:
    """Add a parity line (y = x) to the provided axis."""
    if ax is None:
        ax = plt.gca()

    # zorder=0 ensures other plotted data displays on top of line
    default_kwargs = dict(alpha=0.5, zorder=0, linestyle="dashed", color="black")
    (identity,) = ax.plot([], [], **default_kwargs, **line_kwargs)

    def callback(axes: Axes) -> None:
        x_min, x_max = axes.get_xlim()
        y_min, y_max = axes.get_ylim()
        low = max(x_min, y_min)
        high = min(x_max, y_max)
        identity.set_data([low, high], [low, high])

    callback(ax)
    # Register callbacks to update identity line when moving plots in interactive
    # mode to ensure line always extend to plot edges.
    ax.callbacks.connect("xlim_changed", callback)
    ax.callbacks.connect("ylim_changed", callback)


fig, (ax1, ax2) = plt.subplots(1, 2, sharex=True, sharey=True)

ax1.plot([0, 1], [1, 0])
add_identity(ax1)

ax2.plot([0, 2], [2, 0])
add_identity(ax2)

plt.savefig('tmp.png') |
|
While not the point of this issue, that identity line can be achieved with |
|
@QuLogic Damn, that's what I get for not reading the docs closely enough: unnecessary work reinventing a (worse) wheel. Thanks for the pointer! |
|
No worries, it's new-ish. |
Bug report
Bug summary
When an axis is shared with another its registered "xlim_changed" callbacks does not get called when the change is induced by a shared axis (via sharex=).
In _base.py the set_xlim for sibling axis are called with emit=False:
I'm very new to matplotlib, so perhaps there is a good reason for this? emit=False seems to disable both continued "inheritance" of axis (why?) and triggering of change callbacks (looking at the code above).
It seems like one would at least want to trigger the xlim_changed callbacks as they would be intended to react to any change in axis limits.
Edit: Setting emit=True seems to introduce a recursion issue (not sure why but as inheritance seems to be passed along anyway it doesn't really matter). Moving the callback call to outside of the "if emit:"-statement seems to solve the issue as far as I can see when trying it out. Any reason to keep it inside the if-statement?
The text was updated successfully, but these errors were encountered: