Skip to content
New issue

Have a question about this project? Sign up for a free GitHub account to open an issue and contact its maintainers and the community.

By clicking “Sign up for GitHub”, you agree to our terms of service and privacy statement. We’ll occasionally send you account related emails.

Already on GitHub? Sign in to your account

the limits of axes are inexact with mplot3d #18052

Closed
ultimatile opened this issue Jul 24, 2020 · 6 comments · Fixed by #25272
Closed

the limits of axes are inexact with mplot3d #18052

ultimatile opened this issue Jul 24, 2020 · 6 comments · Fixed by #25272
Labels
API: changes API: consistency Difficulty: Medium https://matplotlib.org/devdocs/devel/contribute.html#good-first-issues status: confirmed bug topic: mplot3d
Milestone

Comments

@ultimatile
Copy link

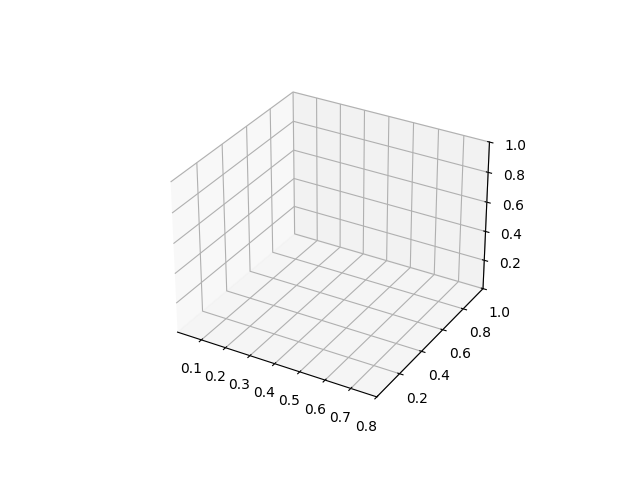
I take an example from
https://stackoverflow.com/questions/23951230/python-axis-limit-in-matplotlib

In mplot3d, when you set, for example, set_xlim(0, 0.8), the outcome has an extra like set_xlim(0 - eps, 0.8 + eps), where eps is related to deltas.

deltas = (maxs - mins) / 12.

To show the exact lims, you have to change deltas to, for example, 0 * (maxs - mins) / 12.

You need something to set exact lims without touching the inside of matplotlib.

Code for reproduction

from mpl_toolkits.mplot3d import Axes3D
import matplotlib.pyplot as plt
fig = plt.figure()
ax = fig.gca(projection = '3d')
ax.set_xlim(0,0.8)
plt.show()

Actual outcome
fig

Matplotlib version

  • Operating system:macOS 10.14.6
  • Matplotlib version: 3.1.1
  • Python version: 3.7.4

The problem was discussed many times in STACK OVERFLOW:
https://stackoverflow.com/questions/23951230/python-axis-limit-in-matplotlib
https://stackoverflow.com/questions/46380464/matplotlib-3d-axis-bounds-always-too-large-doesnt-set-lims-correctly
https://stackoverflow.com/questions/16488182/removing-axes-margins-in-3d-plot

@timhoffm
Copy link
Member

The relevant code is

mins = mins - deltas / 4.

which auto-expands the bounds. We actually want auto-expansion for automatically determined bounds, but not for user bounds.

👉 Things to do:

  • Check how the expansion is done in 2D. (I assume it works slightly differently and the 3D code was added ad-hoc).
  • Implement a way to not expand the bounds if they were set by the user.
  • There seems to be an interference between the grid line and the axis line if the axis limits were set explicitly. For below image, I've deactivated the expansion code above and used set_xlim. Note that the xaxis line is blurry.
    image

@timhoffm timhoffm added status: confirmed bug Difficulty: Medium https://matplotlib.org/devdocs/devel/contribute.html#good-first-issues API: changes API: consistency labels Jul 25, 2020
@neil-and-void
Copy link
Contributor

I'd be interested in looking into this

@tacaswell tacaswell added this to the v3.4.0 milestone Aug 3, 2020
@tacaswell
Copy link
Member

Great @neilZon ! Please let us know if you have any questions (either here or on https://gitter.im/matplotlib/matplotlib )

@QuLogic QuLogic modified the milestones: v3.4.0, v3.5.0 Jan 27, 2021
@kentcr
Copy link
Contributor

kentcr commented Mar 3, 2021

  • Check how the expansion is done in 2D. (I assume it works slightly differently and the 3D code was added ad-hoc).

A default plot immediately sets both _stale_viewlim_* variables to True:

self._request_autoscale_view(scalex=scalex, scaley=scaley)

def _request_autoscale_view(self, tight=None, scalex=True, scaley=True):
if tight is not None:
self._tight = tight
if scalex:
self._stale_viewlim_x = True # Else keep old state.
if scaley:
self._stale_viewlim_y = True

A draw calls _unstale_viewLim():

self._unstale_viewLim()

The _stale_viewlim_* values cause it to get autoscaled:

def _unstale_viewLim(self):
# We should arrange to store this information once per share-group
# instead of on every axis.
scalex = any(ax._stale_viewlim_x
for ax in self._shared_x_axes.get_siblings(self))
scaley = any(ax._stale_viewlim_y
for ax in self._shared_y_axes.get_siblings(self))
if scalex or scaley:
for ax in self._shared_x_axes.get_siblings(self):
ax._stale_viewlim_x = False
for ax in self._shared_y_axes.get_siblings(self):
ax._stale_viewlim_y = False
self.autoscale_view(scalex=scalex, scaley=scaley)

This inner function is called for each, which does the (much more detailed) 2D bound calculations:

def handle_single_axis(scale, autoscaleon, shared_axes, interval,
minpos, axis, margin, stickies, set_bound):
if not (scale and autoscaleon):
return # nothing to do...
shared = shared_axes.get_siblings(self)
# Base autoscaling on finite data limits when there is at least one
# finite data limit among all the shared_axes and intervals.
# Also, find the minimum minpos for use in the margin calculation.
x_values = []
minimum_minpos = np.inf
for ax in shared:
x_values.extend(getattr(ax.dataLim, interval))
minimum_minpos = min(minimum_minpos,
getattr(ax.dataLim, minpos))
x_values = np.extract(np.isfinite(x_values), x_values)
if x_values.size >= 1:
x0, x1 = (x_values.min(), x_values.max())
else:
x0, x1 = (-np.inf, np.inf)
# If x0 and x1 are non finite, use the locator to figure out
# default limits.
locator = axis.get_major_locator()
x0, x1 = locator.nonsingular(x0, x1)
# Prevent margin addition from crossing a sticky value. A small
# tolerance must be added due to floating point issues with
# streamplot; it is defined relative to x0, x1, x1-x0 but has
# no absolute term (e.g. "+1e-8") to avoid issues when working with
# datasets where all values are tiny (less than 1e-8).
tol = 1e-5 * max(abs(x0), abs(x1), abs(x1 - x0))
# Index of largest element < x0 + tol, if any.
i0 = stickies.searchsorted(x0 + tol) - 1
x0bound = stickies[i0] if i0 != -1 else None
# Index of smallest element > x1 - tol, if any.
i1 = stickies.searchsorted(x1 - tol)
x1bound = stickies[i1] if i1 != len(stickies) else None
# Add the margin in figure space and then transform back, to handle
# non-linear scales.
transform = axis.get_transform()
inverse_trans = transform.inverted()
x0, x1 = axis._scale.limit_range_for_scale(x0, x1, minimum_minpos)
x0t, x1t = transform.transform([x0, x1])
delta = (x1t - x0t) * margin
if not np.isfinite(delta):
delta = 0 # If a bound isn't finite, set margin to zero.
x0, x1 = inverse_trans.transform([x0t - delta, x1t + delta])
# Apply sticky bounds.
if x0bound is not None:
x0 = max(x0, x0bound)
if x1bound is not None:
x1 = min(x1, x1bound)
if not self._tight:
x0, x1 = locator.view_limits(x0, x1)
set_bound(x0, x1)
# End of definition of internal function 'handle_single_axis'.
handle_single_axis(
scalex, self._autoscaleXon, self._shared_x_axes, 'intervalx',
'minposx', self.xaxis, self._xmargin, x_stickies, self.set_xbound)
handle_single_axis(
scaley, self._autoscaleYon, self._shared_y_axes, 'intervaly',
'minposy', self.yaxis, self._ymargin, y_stickies, self.set_ybound)

If you call, e.g., set_xlim the _stale_viewlim_x gets set to False which prevents the above:

# Mark viewlims as no longer stale without triggering an autoscale.
for ax in self._shared_x_axes.get_siblings(self):
ax._stale_viewlim_x = False

Meanwhile, axes3d.py has an identical-but-for-z _unstale_viewLim function, but its autoscale_view is wildly different. Normally I'd think it'd be desirable to make the code as dimension-agnostic as possible and share code between them, but I haven't noticed a lot of precedence for that. Is it avoided for some reason?

@m4reko
Copy link
Contributor

m4reko commented Mar 7, 2021

We are a group of students that have looked into this for a while as part of a course.

Thank you @kentcr for some excellent documentation of the 2D-case. It helped us a lot.


  • Implement a way to not expand the bounds if they were set by the user.

Actually, it seems that this is already done in the autoscale_view and the only step needed to get the desired behaviour is to remove these lines:

mins = mins - deltas / 4.
maxs = maxs + deltas / 4.

The autoscale_view adds margins (_xmargin, _ymargin, _zmargin) with to the same logic as in the 2D case. It's a bit of a mystery to us as to why these deltas where added in the beginning. We ran the whole test suite with those lines removed and looked through all the generated images in result_images and it seems to behave properly apart from this:

  • There seems to be an interference between the grid line and the axis line if the axis limits were set explicitly. For below image, I've deactivated the expansion code above and used set_xlim. Note that the xaxis line is blurry.

This problem is not correlating with setting the xlim manually but it happens every time a gridline is aligned with the xaxis (only the xaxis however, not the other ones). We tried to solve this problem both by experimenting with the zorder and the order in which the different components of the axis (gridlines, ticks, spines) are drawn but could not find a solution. Does anybody have an idea of what is happening here?

@kentcr
Copy link
Contributor

kentcr commented Mar 8, 2021

Does anybody have an idea of what is happening here?

It's a y-tick being drawn. If you clear the y-ticks, it disappears:

import matplotlib.pyplot as plt
from mpl_toolkits.mplot3d import Axes3D
fig = plt.figure()
ax = fig.gca(projection=Axes3D.name)
ax.set_yticks([])
ax.set_xlim(0, 0.8)
plt.show()

Figure_1

Further, if you remove the first tick in each axis here...

ticks = self._update_ticks()

e.g.

        ticks = self._update_ticks()[1:]

...it fixes this problem, but you lose the gridline where the background planes intersect:
Figure_2

I'd initially hoped to just change _update_ticks() for the y case, but it's actually inherited from the 2D class:

class Axis(maxis.XAxis):

from matplotlib import (
artist, lines as mlines, axis as maxis, patches as mpatches, rcParams)

class XAxis(Axis):

def _update_ticks(self):

It does seem possible to just change the ticks just for the y-axis, but the obvious ways don't seem very elegant to me. Of course, it's also rather fishy that the 3D YAxis and ZAxis classes are inheriting from the 2D XAxis class, so maybe elegance is a lost cause without more significant changes.

It may also be that the ticks are actually fine and it's some lower-level rendering issue, but I haven't dug that far yet.

Edit: I should say it's actually clear that the ticks are fine, but the gridlines (which are generated from the ticks and put in the xyz0 variable) may also be fine. I haven't dug into whether or not they are drawn when overlapping with the axis on purpose.

Sign up for free to join this conversation on GitHub. Already have an account? Sign in to comment
Labels
API: changes API: consistency Difficulty: Medium https://matplotlib.org/devdocs/devel/contribute.html#good-first-issues status: confirmed bug topic: mplot3d
Projects
None yet
Development

Successfully merging a pull request may close this issue.

9 participants