[Bug]: Incorrect color mapping close to normalization limits for float32 inputs #21167
Comments
|
Since this bug was already introduced in 3.3 (via #17636), and large float32 are rather an edge-case, I don't think this should hold up the 3.5 release. If a fix happens to be ready for 3.5.0, we can take it. Otherwise the fix should simply be shifted to a later release. |
|
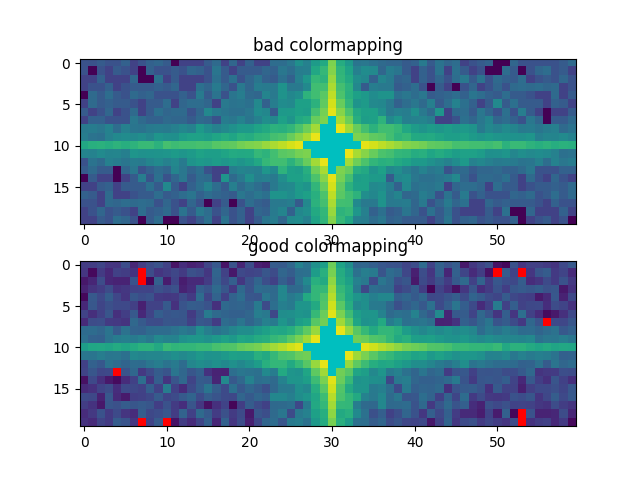
I am not sure that this is fixable. Because we are squashing everything down to [.1, .9] if you are using a large fraction of the dynamic range of float32 (or float64) we will squash them together due to insufficient precision. The bug that #17636 fixes is that sometimes values that should be in-gamut are mapped to out-of-gamut. This bug is that some values that should be out-of-gamut are swept up and pulled to be in-gamumt. We have to do the in/out of gamut test after resampling because otherwise when we are using big kernels we end up poisoning big areas of the image (we have bug reports about that too). I think the right fix here is to do what @anntzer has been advocating for a while which is to completely re-write the resampling code so that we do not have to internally rescale. Tweaking the example a bit we get: from pylab import *
rcdefaults()
t = loadtxt("t.txt").astype(float32).reshape(20, 60)
get_cmap('viridis').set_under('r')
get_cmap('viridis').set_over('c')
subplot(211)
title("bad colormapping")
imshow(t, norm=mpl.colors.LogNorm(1e4, 3e8))
subplot(212)
title("good colormapping")
imshow(t, norm=mpl.colors.LogNorm(1e4, 3e8), interpolation_stage="rgba")
show()
|
|
Thanks for the investigation. I guess the full rewrite of the resampling code is not going to happen any time soon (well, perhaps that's a GSOC project), but considering possible stopgaps, perhaps we can auto-upcast float32 to float64 at the make_image stage? At least we could do so if the image has at least than 3 screen pixels per data point, because in that case the memory cost of the final RGBA array (in screen pixels) would be bigger than the temporary float64 array anyways. (Yuck...) |
|
Up-casting to float64 is probably the quickest option. Adding the "normed" interpolation stage is also reasonable (iirc we went with a string value exactly to allow this option but decided to wait for someone to ask for it before implementing it). |
|
Yes I was just too lazy to implement the "normed" version. The compress/uncompressed step is a bit convoluted so I didn't want to make a mistake. I also strongly support rewriting the resample code to preserve over/under values. Great GSOC project! |
|
As prior art, I'll note that skimage has resampling, probably not with all the kernels agg has, but... They do call out to a C layer at the end, and I'm not sure that could be avoided. I do wonder if it would be worth making them a dependency for resampling, assuming they do what we want with over/under and invalid: https://github.com/scikit-image/scikit-image/blob/main/skimage/transform/_warps_cy.pyx |
|
Note that pillow also has a resize: https://pillow.readthedocs.io/en/stable/reference/Image.html#PIL.Image.Image.resize |
|
I am going to see how bad it is to add the interpolation stage option here. |
|
I think the issue we encountered with imshow LogNorm is related: zeroed-out data shows up in LogNorm plotting as nonzero, with some spatial pattern(!). Example: The filled-in block structure on the left-hand plot is existing (non-negative) data (slice of a datacube), while the surrounding white region (with dots) is zero-filled. On the right-hand side, it is quite a bit worse (datacube sliced along another axis): the zero-filled outer region shows up as nonzero, with intermittent white pixels. You can see the existing non-negative data as a halo without white dots around the squiggle. Edit: This is dependent on rendering resolution: saving at high dpi produces clean images, default rasterization produces the patterns. |

|
We now allow interpolation to happen in rgba space rather than data space. That should fix your visual dpi dependent problem. See https://matplotlib.org/stable/gallery/images_contours_and_fields/image_antialiasing.html and the interpolation_stage kwarg |
|
I also saw this speckle pattern this week and fixed it by going to I think that his is highlights an issue with the default interpolation being anti-aliased which makes sense when most of your image is noisy and in the middle of your limits, but if you set a different under color and have big constant ranges either end it goes sideways really fast: You can reproduce this issue without any huge numbers or logscale: import matplotlib.pyplot as plt
import numpy as np
fig, ((ax1, ax2), (ax3, ax4)) = plt.subplots(
2, 2, sharex=True, sharey=True, layout="constrained"
)
img = ((np.arange(1024).reshape(-1, 1) * np.ones(720)) // 50).T
cm = plt.get_cmap("viridis")
cm.set_under("w")
ax1.set_title("default interpolation ('antialiased') [data]")
ax1.imshow(np.triu(img), vmin=0, cmap=cm)
ax2.set_title("'nearest' interpolation [data]")
ax2.imshow(np.triu(img), vmin=0, cmap=cm, interpolation="nearest")
ax3.set_title("default interpolation ('antialiased') [rgba]")
ax3.imshow(np.triu(img), vmin=0, cmap=cm, interpolation_stage='rgba')
ax4.set_title("'nearest' interpolation [rgba]")
ax4.imshow(np.triu(img), vmin=0, cmap=cm, interpolation="nearest", interpolation_stage='rgba')
plt.show()
If you interactively zoom the noise changes (it looks geometric and I suspect back out something about the kernel from this failure, but that is besides the point) and eventually you get past the threshold where we try to do the anti-aliasing and snap to |

|
I actually strongly feel the default interpolation stage should be RGBA. As soon as we resample, the original data is lost, and we should be doing that loss visually rather than in data space so that when you zoom the changes happen visually. I don't think we should be doing data processing, which is what the default interpolation stage does. |
|
As we have been over several times, I feel strongly that we should not be doing RGBA interpolation as it puts colors that are not in the colormap in the output and moving to do the interpolation in dataspace was one of the big fixes that went in in mpl 2.0. |
|
Thats fine, though it leads to pathologies like this. I'd be against changing the default interpolation which has a huge benefit to reduce aliasing moire effects due to down-sampling. In this case, the choice of the under color can easily be mitigated by setting vmin=-1e-15 if the user didn't want to interpolate in RGBA space. Or they can put up with potential moire effects if they want and use 'nearest' I will reiterate that I true-to-life had a student plotting ocean currents that had a very strong 12-h cycle in them due to the tide that was aliased back to 3 weeks because they had an image with 3 years of data, and they tried to interpret that signal. You really don't want aliasing because of your figure resolution. |
This use case uses LogNorm, so negative vmin does not work. The dataset is originally sparse data, resampled to uniform grid, so there is definitely a need for handling under color separately from non-existing data. Filling non-existing data with NaNs of course works, but zero-filling the non-existing data also makes physical sense, and I can see us preferring to do that instead of NaN-filling for some applications. What really boggled me here is that this interpolation artefact happens when interpolating between what are, ostensibly, zero values (when doing the zero-filling). The above discussion about value squashing does explain it from the code standpoint, but it is pretty confounding for an end-user. |
|
You are always going to get numerical noise no matter what anti aliasing you use. For your situation you may want to turn the anti aliasing off. This is documented in imshow. Is there some way we could have made it more clear? |
|
If @anntzer and @jklymak can make the call this week, lets put in on the agenda. I'm quite unhappy about the prospect of going to AA + RGB interplotaion by default, but I think mix of AA + dataspace giving salt-and-pepper is worse. I suspect the consensus is going to be to go that way (rather than going back to 'nearest' as the default) but I think it is worth having a high-bandwidth discussion rather than text. Is using a different kernel for the AA a practical option? Can we scale the kernel size with the amount of down-sampling we have to do? |
|
Sure, I'll be there. |
|
I don't think this is related to kernel size, but rather (without proof...) that filtering a flat region very close to vmin results in computing I guess(?), off the top of my head, one (costly) way to improve on this would be (only in the interpolation_stage=data + non-nearest interpolation case) to check whether 1) any values in the interpolated dataset are below vmin (and ditto wrt vmax) (*) and 2) the colormap is discontinuous at vmin (the under color is not the zero color). If so, go back to the original data, compute (*) Possibly, if we want to be even less wasteful, we could do some numerical analysis to prove an upper bound on the error |
Antialiasing is documented, but I don't think it is obvious (nor desirable) that anti-aliasing a constant value should produce non-constant outputs.
This is likely the explanation. With the [0.1,0.9] rescaling and clamping of data-space interpolation this also explains why flat zero arrays get resampled to non-zero values (source does point out that dyadic number offsets could help with precision as well, but introduce other bugs...). My two cents to the discussion between interpolation on data space/rgba space would be that if resampling is done on the data space, it would be preferable if it were done on the initial, non-rescaled data. That would conserve as much precision as possible, and would avoid turning zero values to non-zero values.
I guess this could also be generalized to check whether or not the subarray that is being resample is actually constant under the kernel, and then just use the constant value instead. This would also help with the LogNorm case, where it would be nice to keep zero values as zero, while vmin remains positive. |
Desirable or not, this is just a consequence of doing any math with floating point numbers. 1-1e-14 is not distinguishable from 1+1e-14, so if your colour boundary is exactly at 1.0, half the values will be under, and half will be over. This typically is not a problem for a continuous colormap as the shades of colour will be close to one another. Its also not a problem for the default under colour, which is the same as the lowest colour in the colormap. Why it causes problems here is that you have set the under colour to a very different colour than the lowest color on the colormap, and hence having vmin right at the boundary causes the visual disparity. You won't get this issue doing the interpolation in RGBA space, because the tiny jitter in the RGBA values wont' appear any different than the "constant" value.
The scaling in data space is to take care of this exact issue, unfortunately. If you don't allow a buffer on either side of 0.1 and 0.9 you get ringing that pollutes the good data with any "bad" (over/under/NaN) cells.
This is probably possible, but I think someone would have to tear into the Agg C-code and add this to the kernel evaluator. Given that there are existing solutions to this artefact, I am not sure it is worth the considerable effort (and break from historical Agg). @anntzer's solution could be done at a level above the Agg C-code, but would add a lot of complexity to an already complex code path. The existing solutions are to use |
Yes, I suspect there is some nitty-gritty behind the choice. I'm not quite intuiting why resampling the unscaled data and scaling afterwards should matter, but.. I guess that's in the nitty-gritty.
Yes, thank you! This is just a fairly interesting edge case to consider, if you don't mind my commenting here :).
This is actually not my issue - vmin is working as intended and without issue in this particular case. Instead, the same floating-point accuracy issue comes up when plotting large swaths of zeroed sections of data with LogNorm:
Would rounding the resampled data within an epsilon of vmin/vmax/0 to exactly vmin/vmax/0 break things? |

|
@alhom Can you fabricate an example that shows your problem with log that we can generate? |
|
Sure! Adapting your test: import matplotlib.pyplot as plt
import numpy as np
fig, ((ax1, ax2), (ax3, ax4)) = plt.subplots(
2, 2, sharex=True, sharey=True, layout="constrained"
)
img = ((np.arange(1024).reshape(-1, 1) * np.ones(720)) // 50).T
cm = plt.get_cmap("viridis")
cm.set_under("r")
cm.set_over("m")
ax1.set_title("default interpolation ('antialiased') [data]")
ax1.imshow(np.triu(img), cmap=cm,norm=colors.LogNorm(vmin=3, vmax=11))
ax2.set_title("'nearest' interpolation [data]")
ax2.imshow(np.triu(img), cmap=cm, interpolation="nearest",norm=colors.LogNorm(vmin=3, vmax=11))
ax3.set_title("default interpolation ('antialiased') [rgba]")
ax3.imshow(np.triu(img), cmap=cm, interpolation_stage='rgba',norm=colors.LogNorm(vmin=3, vmax=11))
ax4.set_title("'nearest' interpolation [rgba]")
ax4.imshow(np.triu(img), cmap=cm, interpolation="nearest", interpolation_stage='rgba', norm=colors.LogNorm(vmin=3, vmax=11))
plt.show()produces the salt-and-pepper both at vmin and at zero values:
Edit: added suitable vmax for completeness. |

|
Ok but this is basically the same thing. You are counting on zero mapping to the not-a-number colour (white) but the smoothing in data space is making that occasionally be infinitesimally greater than zero and hence no longer NaN under log norm. If it were me and I had need of anti aliasing and a strong objection to interpolating in rgba space I'd simply subtract 1e-13 (or scaled as appropriate) from all my data to force all the zeros to be infinitesimally negative. |
|
It is also worth noting that this does not show up in the default cases with over/under because the default over/under colors are the bottom/top of the colormaps so it has no visual appearance. |
|
Well you will get blue speckles instead of red, but you will still get speckles. |
|
Right, in the default case it is only the "bad" speckles, but not the over/under speckles that you can see. |
|
Actually, looking at it again, it seems like it's easy(?) to get rid of the 0-1 clipping in the agg filters: the following patch seems to work (on some extremely cursory checks) diff --git i/extern/agg24-svn/include/agg_span_image_filter_gray.h w/extern/agg24-svn/include/agg_span_image_filter_gray.h
index e2c688e004..7ecfdf8186 100644
--- i/extern/agg24-svn/include/agg_span_image_filter_gray.h
+++ w/extern/agg24-svn/include/agg_span_image_filter_gray.h
@@ -397,7 +397,6 @@ namespace agg
fg += weight * *fg_ptr;
fg >>= image_filter_shift;
- if(fg > color_type::full_value()) fg = color_type::full_value();
span->v = (value_type)fg;
span->a = color_type::full_value();
@@ -491,8 +490,6 @@ namespace agg
}
fg = color_type::downshift(fg, image_filter_shift);
- if(fg < 0) fg = 0;
- if(fg > color_type::full_value()) fg = color_type::full_value();
span->v = (value_type)fg;
span->a = color_type::full_value();
@@ -593,8 +590,6 @@ namespace agg
}
fg /= total_weight;
- if(fg < 0) fg = 0;
- if(fg > color_type::full_value()) fg = color_type::full_value();
span->v = (value_type)fg;
span->a = color_type::full_value();
@@ -701,8 +696,6 @@ namespace agg
}
fg /= total_weight;
- if(fg < 0) fg = 0;
- if(fg > color_type::full_value()) fg = color_type::full_value();
span->v = (value_type)fg;
span->a = color_type::full_value();
diff --git i/lib/matplotlib/image.py w/lib/matplotlib/image.py
index 5b01525053..2b89cec459 100644
--- i/lib/matplotlib/image.py
+++ w/lib/matplotlib/image.py
@@ -473,14 +473,6 @@ class _ImageBase(martist.Artist, cm.ScalarMappable):
if newmax is not None or newmin is not None:
np.clip(A_scaled, newmin, newmax, out=A_scaled)
- # Rescale the raw data to [offset, 1-offset] so that the
- # resampling code will run cleanly. Using dyadic numbers here
- # could reduce the error, but would not fully eliminate it and
- # breaks a number of tests (due to the slightly different
- # error bouncing some pixels across a boundary in the (very
- # quantized) colormapping step).
- offset = .1
- frac = .8
# Run vmin/vmax through the same rescaling as the raw data;
# otherwise, data values close or equal to the boundaries can
# end up on the wrong side due to floating point error.
@@ -489,31 +481,8 @@ class _ImageBase(martist.Artist, cm.ScalarMappable):
vmin, vmax = a_min, a_max
vrange = np.array([vmin, vmax], dtype=scaled_dtype)
- A_scaled -= a_min
- vrange -= a_min
- # .item() handles a_min/a_max being ndarray subclasses.
- a_min = a_min.astype(scaled_dtype).item()
- a_max = a_max.astype(scaled_dtype).item()
-
- if a_min != a_max:
- A_scaled /= ((a_max - a_min) / frac)
- vrange /= ((a_max - a_min) / frac)
- A_scaled += offset
- vrange += offset
- # resample the input data to the correct resolution and shape
A_resampled = _resample(self, A_scaled, out_shape, t)
- del A_scaled # Make sure we don't use A_scaled anymore!
- # Un-scale the resampled data to approximately the original
- # range. Things that interpolated to outside the original range
- # will still be outside, but possibly clipped in the case of
- # higher order interpolation + drastically changing data.
- A_resampled -= offset
- vrange -= offset
- if a_min != a_max:
- A_resampled *= ((a_max - a_min) / frac)
- vrange *= ((a_max - a_min) / frac)
- A_resampled += a_min
- vrange += a_min
+
# if using NoNorm, cast back to the original datatype
if isinstance(self.norm, mcolors.NoNorm):
A_resampled = A_resampled.astype(A.dtype)(further cleanups and removals of now-unneeded code likely possible) I suspect that Agg does the 0-1 clipping because it is designed to filter (in the case we are using here for interpolation_stage="data") 0-1 grayscale images and it knows that due to FP slop the filter may return slightly out of range values which may be problematic for downstream processing. We don't actually use that filter for its original purpose, but to filter "data", not "grayscale images" (for rgba images we use the span_image_rgba_... filters, whose clipping is untouched by this patch). (To test this, try e.g. patching just the Python side (i.e. removing our scale-to-01-before-agg-filtering-and-unscaling) and imshow an image with values out of 0-1, e.g. |
|
@anntzer, that seems helpful to avoid the scaling we do. Perhaps we would want that to be a new method rather than modify the Agg method? That may fix some floating point slop as well, particularly if data is exactly zero, but it won't fix the slop problem in general I don't think? |
|
I don't think this is a general fix for the slop issues, more something we have discussed as being generally desirable and that I realized was much easier than expected. |
Bug summary
Colormapping of values close to normalization limits can incorrectly pass to the "other" side of the normalization limits for float32 inputs.
Bisects to #17636; seems worth marking as release critical?
Code for reproduction
t.txt is below (20x60 array).
t.txt
58942 64279 84722 51856 50055 114166 31931 64794 104959 142180 76242 17195 38894 25839 31804 86433 170174 18076 140152 28781 113055 24886 20566 199163 186778 317594 984360 512459 1751483 3389411 31211444 3886054 1577606 288069 301913 225368 164976 138614 132365 81636 113055 362294 80226 242847 138080 208319 19660 52164 83988 121564 16671 12661 133006 48369 71139 70846 58699 47444 98991 181544 51597 12785 57897 32263 74056 65077 44898 9817 110491 49241 63903 88239 60900 130296 104555 53142 271787 75386 19345 98730 81636 90156 156140 110748 302689 205094 422468 445540 3040181 6595976 36350832 5663832 2471288 476834 828630 694559 150378 385205 289452 90156 24886 114341 51327 240951 30431 239319 85250 35884 64539 16351 6221 192556 79864 9010 51667 148093 200178 56705 81576 34532 19503 30237 111800 31633 27413 27873 136097 9824 12210 232044 21675 78407 22386 34806 34573 62933 235059 93267 230505 52876 132365 289452 118774 74116 228770 126393 467420 1313782 6717006 5249880 52201940 6422516 3467091 926308 657924 104105 568922 354773 118774 156140 20566 101510 59226 129772 61709 187534 350155 74662 268449 61811 165584 114944 93243 212593 37180 49567 100136 57973 132053 54607 26923 47718 65038 110358 44482 52430 77177 84022 80250 127306 95651 130613 27002 39157 228334 142891 356116 155451 54868 333273 138614 385205 354773 336947 1167037 331106 346806 753847 9211976 9462781 70547808 9725218 5119318 683683 94834 410691 347623 336947 74116 110748 199163 63835 11470 80820 41228 15765 53578 152875 38890 59842 136705 68892 160746 195307 160459 197798 129277 160049 19812 45570 12244 178437 99111 206084 88571 48422 157411 115388 135209 57066 52961 56398 104574 57090 376517 86079 261600 72729 271334 409143 164976 150378 568922 347623 1178153 649180 960161 5216739 9148220 15884352 96037200 11980963 4490694 2192027 1580819 858371 1178153 1167037 228770 302689 186778 305984 92220 102448 142893 206076 106498 274349 185133 106091 86607 192704 93840 74332 68584 21219 33778 163443 27021 92291 32329 164155 86692 124985 96082 98376 69642 24929 76129 76726 186452 42945 145814 211285 192607 138585 41816 345575 264420 282978 225368 694559 104105 410691 858371 692663 2203776 2175977 5168049 18180770 145174368 21120186 6132431 1220932 1675978 692663 649180 331106 126393 205094 317594 179355 447791 101080 212527 538804 216707 102911 34938 74154 752779 77567 221249 75743 95070 98320 37885 109532 83205 43924 79091 40389 72399 150384 41080 67003 179867 32798 81581 219346 153333 168326 160840 59061 147807 666311 359078 275864 232001 231742 301913 828630 657924 94834 1580818 1675978 2201480 1930727 9904122 27879668 188579536 37623920 11823683 3294144 2201480 2203776 960161 346806 467420 422468 984359 331264 179363 1279143 28910 177820 203292 82542 321653 152878 49501 214673 51216 422250 73355 37575 13370 20210 42246 97859 33492 111170 120062 59432 54656 47767 323076 182785 114577 111761 158382 143199 152446 73415 170167 146138 63660 382964 305597 542623 288069 476834 926308 683683 2192027 1220932 3294145 4291788 20821256 32129888 412815072 68441968 23641976 4291788 1930727 2175977 5216739 753847 1313782 445540 512459 571774 411157 27346 28068 45302 235575 156757 307111 560135 145810 202935 106262 54288 311341 137071 3316 95894 91368 158422 369475 384082 306384 528384 196046 478790 270935 246768 373544 389638 375584 483907 645259 503996 1632341 834880 501539 701974 1076304 1549674 1577606 2471288 3467092 5119318 4490694 6132431 11823684 23641976 61787200 346725376 849581696 202956480 61787196 20821256 9904122 5168048 9148220 9211976 6717006 3040181 1751483 1199501 1764819 1345680 1783324 1319852 1564318 1153096 377857 686835 498827 788838 571207 374124 381619 272980 388745 489991 171466 243212 433585 260956 231523 508013 762529 861655 704439 915865 617364 1283795 995679 975618 1818459 2250059 2323116 1862394 2679919 3635486 2687002 4374014 3886054 5663832 6422516 9725221 11980965 21120186 37623924 68441968 202956512 831329792 10304242688 831329664 346725408 32129886 27879672 18180770 15884350 9462781 5249880 6595976 3389411 3276790 3531027 2603632 2008037 1949634 2408762 1679826 1259959 1671059 1292951 1154145 1129977 1052231 1251848 445428 587955 569234 774290 539593 3038106 4505989 4844850 4124308 5429116 4229763 5436520 7197848 7500659 5115562 10591629 8376190 9306667 9335577 10894294 10362409 14645203 17283184 18426008 26417010 31211444 36350832 52201940 70547808 96037200 145174368 188579536 412815072 849581696 10304243712 28260868030464 10304242688 849581696 412815072 188579568 145174368 96037200 70547808 52201940 36350820 31211434 26417004 18426008 17283190 14645207 10362412 10894296 9335578 9306667 8376194 10591626 5115559 7500658 7197858 5436521 4229763 5429114 4124307 4844848 4505990 562933 539593 774290 569234 587955 445428 1251848 1052231 1129977 1154144 1292951 1671059 1259959 1679826 2408762 1949634 2008037 2603630 3531026 3276790 3389411 6595975 5249880 9462781 15884351 18180772 27879666 32129892 346725376 831329920 10304243712 831329728 202956480 68441968 37623916 21120184 11980963 9725218 6422516 5663832 3886054 4374013 2687003 3635487 2679919 1862394 2323116 2250059 1818459 975618 995679 1283795 617364 915865 704439 861654 762529 508014 231523 260955 72872 243212 171466 489991 388745 272981 381619 374124 571207 788838 498827 686835 377857 1153095 1564318 1319852 1783324 1345679 1764819 1199501 1751483 3040181 6717006 9211979 9148220 5168050 9904122 20821256 61787200 202956512 849581696 346725408 61787196 23641980 11823684 6132431 4490694 5119318 3467091 2471288 1577606 1549674 1076304 701975 501539 834880 1632341 503996 645259 483907 375584 389638 373544 246768 270935 478789 196046 528384 306384 384082 82030 158422 91368 95894 3316 137071 311341 54288 106262 202935 145810 560135 307111 156757 235575 45302 28068 27346 411157 571774 512459 445540 1313782 753846 5216739 2175977 1930727 4291788 23641980 68441976 412815072 32129890 20821256 4291788 3294144 1220932 2192027 683683 926308 476834 288069 542623 305597 382964 63660 146138 170167 73415 152446 143199 158382 111761 114577 182785 323076 47767 54656 59432 120062 111170 15598 97859 42246 20210 13370 37575 73355 422250 51216 214673 49501 152878 321653 82542 203292 177820 28910 1279143 179363 331264 984360 422468 467420 346806 960161 2203776 2201480 3294145 11823685 37623924 188579568 27879670 9904122 1930727 2201480 1675978 1580819 94834 657924 828630 301913 231742 232001 275865 359078 666311 147807 59061 160840 168326 153333 219346 81581 32798 179866 67003 41080 150384 72399 40389 34341 43924 83205 109532 37885 98320 95070 75743 221249 77567 752779 74154 34938 102911 216707 538804 212527 101080 447791 179355 317594 205094 126393 331106 649180 692663 1675978 1220932 6132431 21120184 145174368 18180772 5168048 2175977 2203776 692663 858371 410691 104105 694559 225368 282978 264420 345575 41816 138585 192607 211285 145814 42945 186452 76726 76129 24929 69642 98376 96082 124985 86692 164155 102076 92291 27021 163443 33778 21219 68584 74332 93840 192704 86607 106091 185133 274349 106498 206076 142893 102448 92220 305984 186778 302689 228770 1167037 1178153 858371 1580819 2192027 4490694 11980965 96037200 15884348 9148220 5216739 960161 649180 1178153 347623 568922 150378 164976 409143 271334 72729 261600 86079 376517 57090 104574 56398 52961 57066 135209 115388 157411 48422 88571 206084 99111 178437 64592 45570 19812 160049 129277 197798 160459 195307 160746 68892 136705 59842 38890 152875 53578 15765 41228 80820 11470 63835 199163 110748 74116 336947 347623 410691 94834 683683 5119318 9725221 70547808 9462781 9211979 753847 346806 331106 1167037 336947 354773 385205 138614 333272 54868 155451 356116 142891 228334 39157 27002 130613 95651 127306 80250 84022 77177 52430 44482 110358 65038 47718 37269 54607 132053 57973 100136 49567 37180 212592 93243 114944 165584 61811 268449 74662 350155 187534 61709 129772 59226 101510 20566 156140 118774 354773 568922 104105 657924 926308 3467092 6422516 52201940 5249880 6717006 1313782 467420 126393 228770 74116 118774 289452 132365 52876 230505 93267 235059 62933 34573 34806 22386 78407 21675 232044 12210 9824 136097 27873 27413 31633 111800 30237 44589 34532 81576 56705 200178 148093 51667 9010 79864 192556 6221 16351 64539 35884 85250 239319 30431 240951 51327 114341 24886 90156 289452 385205 150378 694558 828630 476834 2471288 5663832 36350820 6595975 3040181 445540 422468 205094 302689 110748 156140 90156 81636 98730 19345 75386 271787 53142 104555 130296 60900 88239 63903 49241 110491 9817 44898 65077 74056 32263 57897 12785Actual outcome
(github doesn't seem to want to let me attach an example image; I'll try again another time but in the meantime the example should be enough to repro.)
Note the spurious discontinuity in the top plot around the dark "under" pixels.
Expected outcome
Same as with interpolation_stage="rgba" (which really does nothing here, as the image pixels are much bigger than the rendering pixels).
Operating system
No response
Matplotlib Version
3.5b1
Matplotlib Backend
qt5agg
Python version
3.9
Jupyter version
No response
Other libraries
No response
Installation
No response
Conda channel
No response
The text was updated successfully, but these errors were encountered: