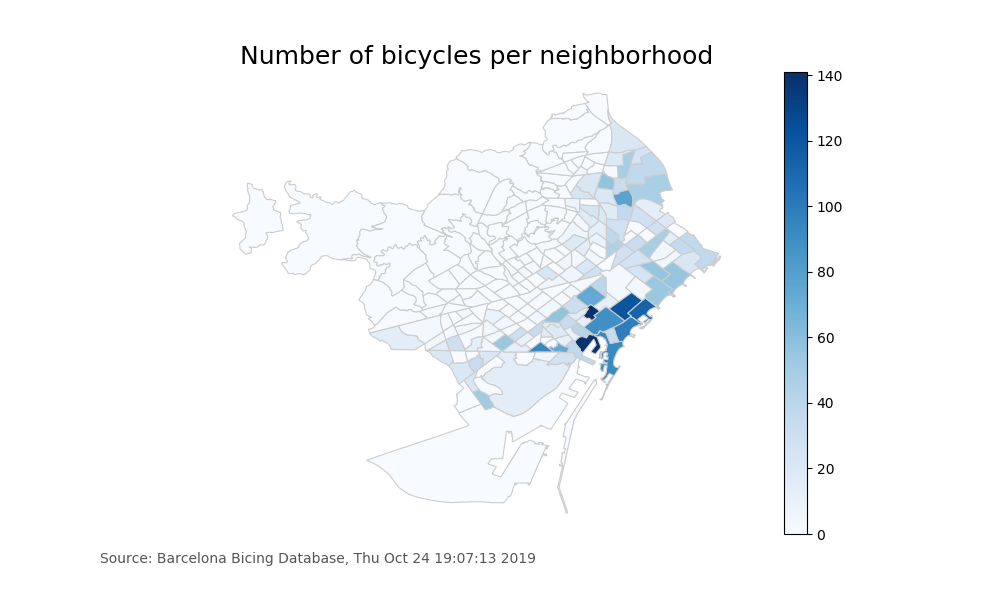
Bike distribution visualization during the day at Bicing stations in Barcelona
This python script downloads the stations status from the official Bicing BCN website, sums the total amount per neighborhood, and visualizes the data using geopandas and shapely.
Example of a single figure: