Skip to content
New issue

Have a question about this project? Sign up for a free GitHub account to open an issue and contact its maintainers and the community.

By clicking “Sign up for GitHub”, you agree to our terms of service and privacy statement. We’ll occasionally send you account related emails.

Already on GitHub? Sign in to your account

Pivot table (v0.38.rc-4) on dashboard, filter by attribute drill through displays as a table not a pivot #14632

Closed
notrom opened this issue Feb 2, 2021 · 1 comment
Assignees
Labels
Priority:P1 Security holes w/o exploit, crashing, setup/upgrade, login, broken common features, correctness Reporting/Dashboards Type:Bug Product defects Visualization/Tables Raw, summarized, and pivoted tables

Comments

@notrom
Copy link

notrom commented Feb 2, 2021

Describe the bug
With a pivot table added to a dashboard, when you click one of the column or row attributes and select the equals "Filter by this value" option the resulting drill through question is displayed as a table, not a filtered pivot table.

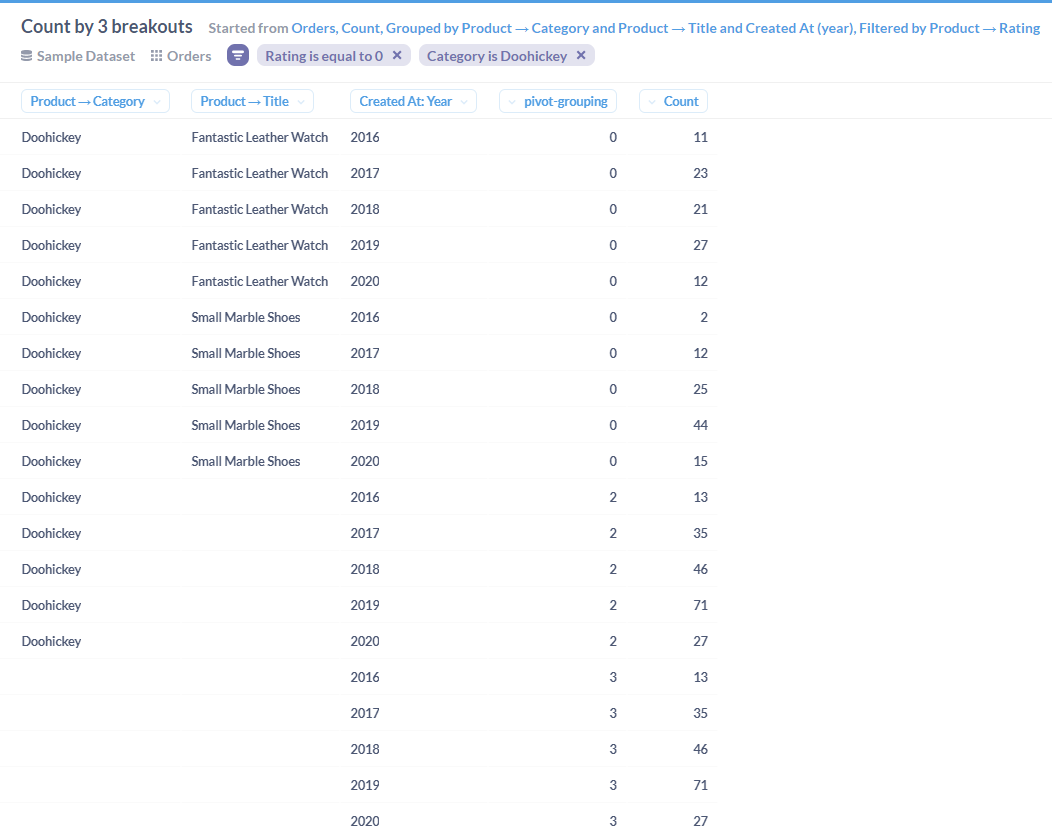
The table it drills to contains a column called "pivot-grouping" field. The table seems to contain all the pivot subtotal levels too and is pretty hard to make sense of.

Also seems to be giving unexpected results for pivots with other combinations of rows and columns..

Logs
Nothing that looks relevant in either server or JS logs

To Reproduce
Steps to reproduce the behavior:

  1. Create and save a pivot table question with at least 2 rows and 1 column attribute
  2. Add that question to a new dashboard
  3. From that dashboard, in the pivot table click one of the row groupings and select the equals "Filter by this value"
  4. The resulting drilled through question is displayed as a standard table, not a pivot.

Expected behavior
Expected the result to be a pivot table filtered by the selected value. I get the expected behaviour when applying a filter in this manner from the pivot table question itself, it behaves differently when applied from a dashboard.

Screenshots
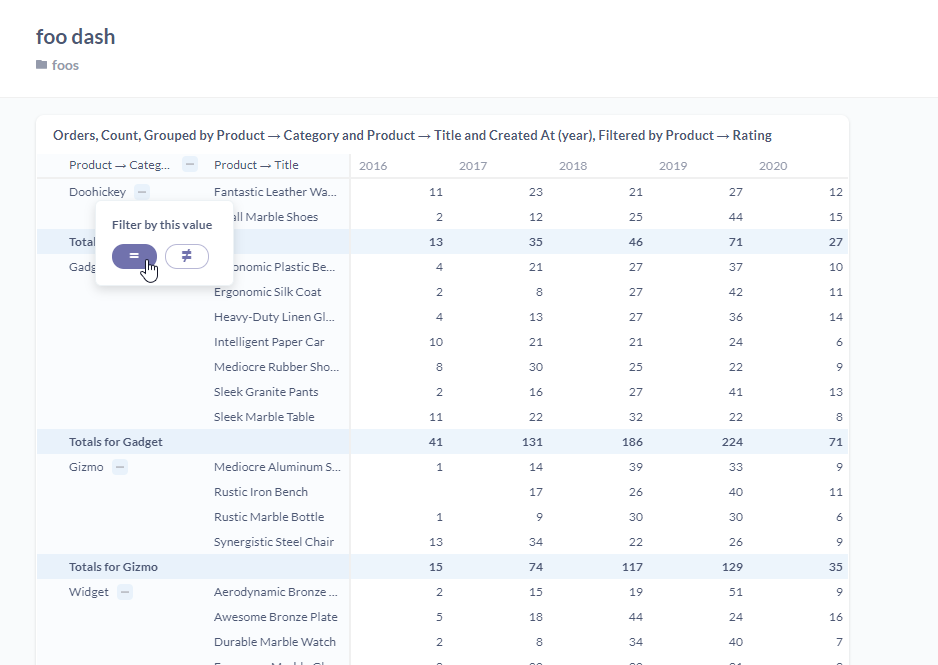
Pivot in a dashboard:
image

The resulting output:
image

Information about your Metabase Installation:

{
  "browser-info": {
    "language": "en-NZ",
    "platform": "Win32",
    "userAgent": "Mozilla/5.0 (Windows NT 10.0; Win64; x64) AppleWebKit/537.36 (KHTML, like Gecko) Chrome/87.0.4280.141 Safari/537.36",
    "vendor": "Google Inc."
  },
  "system-info": {
    "file.encoding": "Cp1252",
    "java.runtime.name": "OpenJDK Runtime Environment",
    "java.runtime.version": "13.0.2+8",
    "java.vendor": "Oracle Corporation",
    "java.vendor.url": "https://java.oracle.com/",
    "java.version": "13.0.2",
    "java.vm.name": "OpenJDK 64-Bit Server VM",
    "java.vm.version": "13.0.2+8",
    "os.name": "Windows 10",
    "os.version": "10.0",
    "user.language": "en",
    "user.timezone": "Pacific/Auckland"
  },
  "metabase-info": {
    "databases": [
      "sqlserver",
      "h2"
    ],
    "hosting-env": "unknown",
    "application-database": "postgres",
    "application-database-details": {
      "database": {
        "name": "PostgreSQL",
        "version": "12.1"
      },
      "jdbc-driver": {
        "name": "PostgreSQL JDBC Driver",
        "version": "42.2.8"
      }
    },
    "run-mode": "prod",
    "version": {
      "date": "2021-01-30",
      "tag": "v0.38.0-rc4",
      "branch": "master",
      "hash": "6312927"
    },
    "settings": {
      "report-timezone": "UTC"
    }
  }
}

Severity
Not critical but unexpected. The data doesn't really make sense in the resulting table. You can fix it by manually changing it to a pivot table visualisation and it all looks good, but it took me a minute to realise what was going on.

Additional context
Pivot tables are still looking good, love it.

@notrom notrom added .Needs Triage Type:Bug Product defects labels Feb 2, 2021
@paulrosenzweig paulrosenzweig self-assigned this Feb 2, 2021
@paulrosenzweig paulrosenzweig added Priority:P2 Average run of the mill bug Reporting/Dashboards Priority:P1 Security holes w/o exploit, crashing, setup/upgrade, login, broken common features, correctness and removed .Needs Triage Priority:P2 Average run of the mill bug labels Feb 2, 2021
@flamber flamber added the Visualization/Tables Raw, summarized, and pivoted tables label Feb 3, 2021
@paulrosenzweig
Copy link
Contributor

Fixed by #14640

This was referenced Feb 5, 2024
Sign up for free to join this conversation on GitHub. Already have an account? Sign in to comment
Labels
Priority:P1 Security holes w/o exploit, crashing, setup/upgrade, login, broken common features, correctness Reporting/Dashboards Type:Bug Product defects Visualization/Tables Raw, summarized, and pivoted tables
Projects
None yet
Development

No branches or pull requests

3 participants