Skip to content
New issue

Have a question about this project? Sign up for a free GitHub account to open an issue and contact its maintainers and the community.

By clicking “Sign up for GitHub”, you agree to our terms of service and privacy statement. We’ll occasionally send you account related emails.

Already on GitHub? Sign in to your account

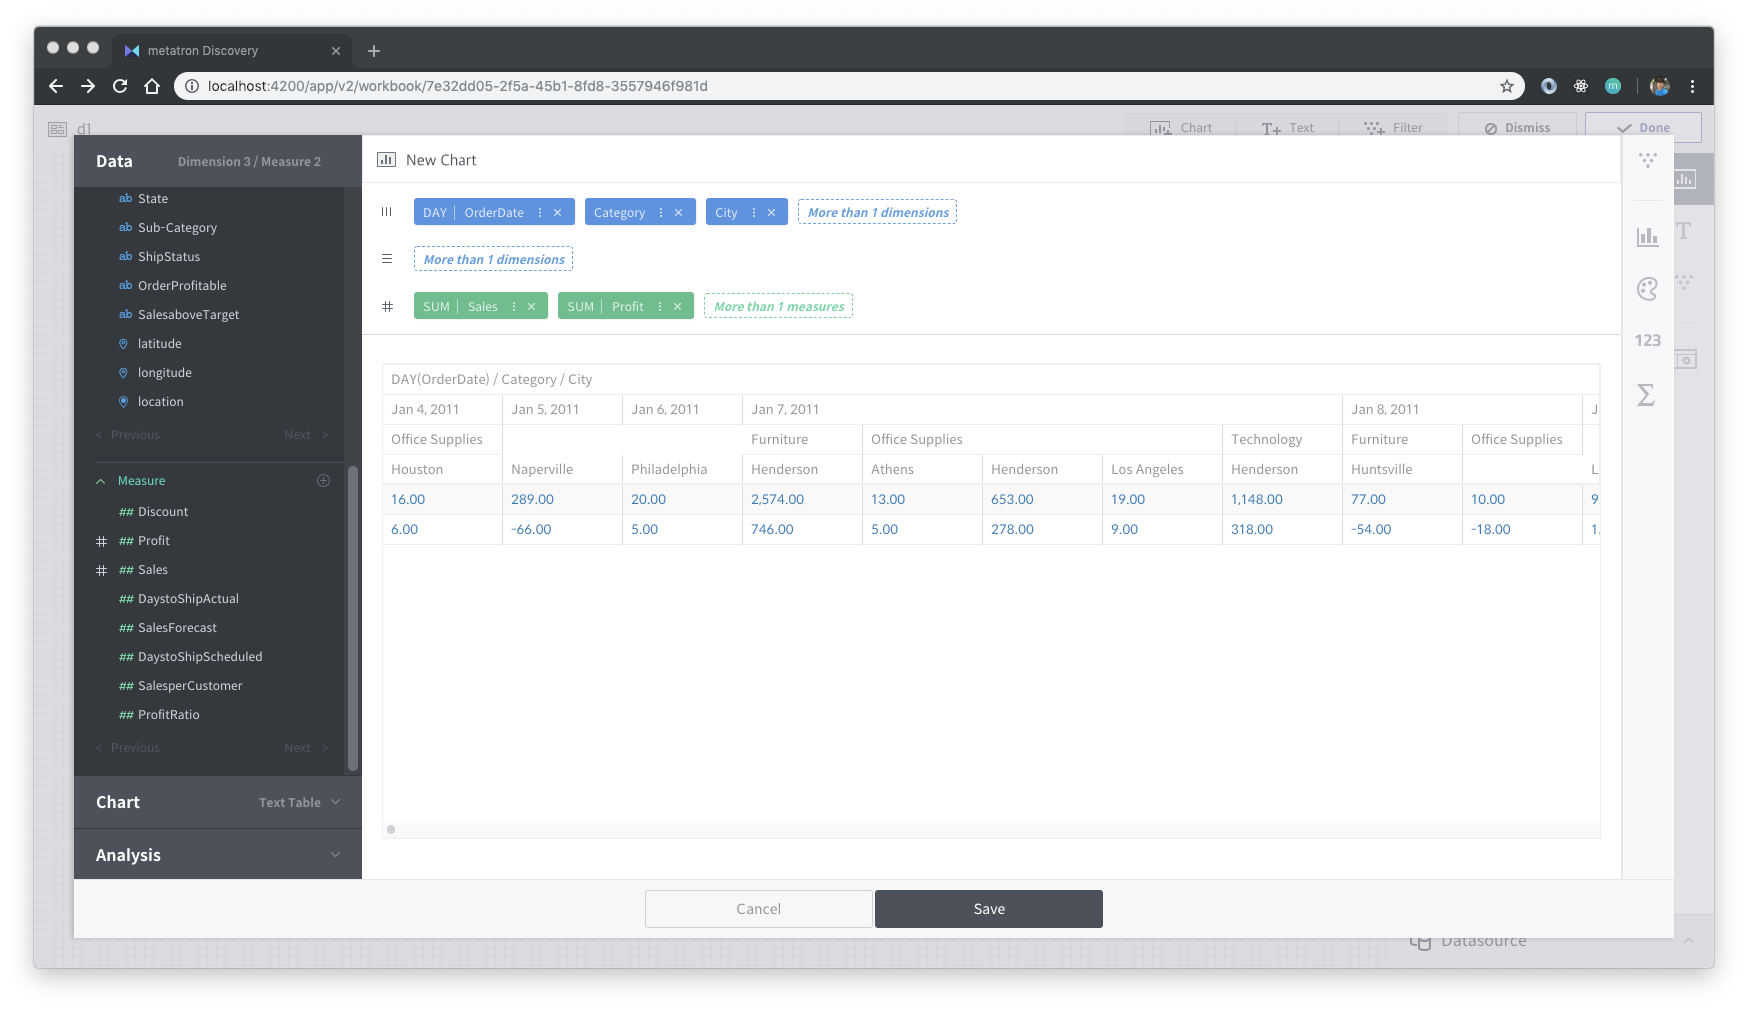
If the data table dimension is 3, and the measure value is 2, the browser does not work #972

Closed
Taehui opened this issue Nov 30, 2018 · 1 comment
Assignees
Labels
bug Something isn't working @chart Chart Component and Widget
Milestone

Comments

@Taehui
Copy link

Taehui commented Nov 30, 2018

Describe the bug

  • 데이터 테이블에서 Dimension 3개, Measure 2개를 표현하려고 하면 브라우저가 죽는 현상(응답없음)

To Reproduce

  1. Go to http://52.231.184.135:8180/app/v2/workbook/d1ca9752-20a9-49b3-ae39-c7c052043160
  2. 첫번째 차트 Edit 모드로 들어감
  3. 첫번째 차트의 선반에 올려진 Dimension, Measure 의 스크린 샷은 아래와 같음

2018-11-30 5 02 24

  1. 위 화면 처럼 디멘젼 3개, 메져 2개가 올려진 상태에서 테이블 차트로 차트타입 변경 시도
    --> 먹통됨

Expected behavior

  • 데이터 양의 문제가 아닌 버그로 보이며, 개선 필요

Desktop (please complete the following information):

  • OS: [e.g. iOS]
  • Browser [e.g. chrome, safari]
  • Version [e.g. 22]
@Taehui Taehui added the bug Something isn't working label Nov 30, 2018
@kyungtaak kyungtaak added the @chart Chart Component and Widget label Dec 9, 2018
@kyungtaak kyungtaak added this to the 3.2.0 milestone Dec 9, 2018
@YooYoungmo YooYoungmo self-assigned this Dec 19, 2018
@YooYoungmo
Copy link
Collaborator

YooYoungmo commented Dec 20, 2018

문제

  • 브라우저가 응답없는 현상은 화면에서 데이터 테이블 차트를 그리기 위해 서버로 부터 받아온 데이터를 오랜 시간 가공하면서 발생함.

원인

  • 데이터 테이블 차트는 기본적으로 피벗 모드이기 때문에 OrderDate, Category, City를 X축에 설정하는 경우 컬럼의 수가 매우 많아짐(OrderDate 별 Category와 각 Category별 City를 표현하기 때문에.)
    image
  • 화면 차트를 만드는 아래 BaseChart 클래스 setUIData에서 데이터를 반복하여 cloneDeep 하면서 발생
// base-chart.ts
export abstract class BaseChart extends AbstractComponent implements OnInit, OnDestroy {
 /**
   * uiData에 설정될 columns데이터 설정
   */
  protected setUIData(): any {
     // ...
     _.each(this.data.columns, (data, index) => {
      data.categoryName = _.cloneDeep(this.data.rows); // 해당 dataIndex걸로 넣어주면됨

      data.categoryValue = [];
      data.categoryPercent = [];

      // 해당 dataIndex걸로 넣어주면됨
      // 단일 series인 경우
      if (!this.data.categories || (this.data.categories && this.data.categories.length == 0)) {
        data.categoryValue = addAllValues(_.cloneDeep(this.originalData.columns), 'value');
        data.categoryPercent = addAllValues(_.cloneDeep(this.data.columns), 'percentage');
        data.seriesName = _.cloneDeep(this.data.rows);
      // 멀티 series인 경우
      } else {
        if (this.data.categories) {
          for (const category of this.data.categories) {
            data.categoryValue = _.cloneDeep(category.value);
            data.categoryPercent = _.cloneDeep(category.percentage);
          }
        }
        data.seriesName = _.split(data.name, CHART_STRING_DELIMITER)[0];
      }

      // 해당 dataIndex로 설정
      data.seriesValue = _.cloneDeep(this.originalData.columns[index].value);
      data.seriesPercent = _.cloneDeep(data.percentage);
    });
    return this.data.columns;
  }
}

Sign up for free to join this conversation on GitHub. Already have an account? Sign in to comment
Labels
bug Something isn't working @chart Chart Component and Widget
Projects
None yet
Development

No branches or pull requests

4 participants