Tempo Tracing

qryn offers experimental support for the Grafana Tempo API providing span ingestion and querying
Within qryn, Tempo Spans/Traces are stored as tagged Logs and are accessible from both LogQL and Tempo APIs
qryn implements a basic Zipkin receiver json/http API endpoint to ingest tracing data.
Send Spans using opentelemetry-js
curl -X POST http://localhost:3100/tempo/api/push -H 'Content-Type: application/json' -d '[{
 "id": "1234",
 "traceId": "d6e9329d67b6146b",
 "timestamp": '$(date +%s%N | cut -b1-16)',
 "duration": 1000,
 "name": "span from bash!",
 "tags": {
    "http.method": "GET",
    "http.path": "/api"
  },
  "localEndpoint": {
    "serviceName": "shell script"
  }
}]'
curl -X POST http://localhost:3100/tempo/api/push  -H 'Content-Type: application/json' -d '[{
 "id": "5678",
 "traceId": "d6e9329d67b6146b",
 "parentId": "1234",
 "timestamp": '$(date +%s%N | cut -b1-16)',
 "duration": 1000,
 "name": "child span from bash!",
  "localEndpoint": {
    "serviceName": "shell script"
  }
}]'

ClickHouse creates trace spans for each query and some of the query execution stages, such as query planning or distributed queries. Using MVs the internal spans can be translated to ZipkinV2 JSON and sent to an OTLP collector such as qryn, jaeger or prometheus.

- Enable opentelemetry settings in your ClickHouse
config.xml
The following MV will push traces to the qryn /tempo API using the ClickHouse URL engine
CREATE MATERIALIZED VIEW default.zipkin_spans
ENGINE = URL('http://127.0.0.1:3100/tempo/api/push', 'JSONEachRow')
SETTINGS output_format_json_named_tuples_as_objects = 1,
    output_format_json_array_of_rows = 1 AS
SELECT
    lower(hex(reinterpretAsFixedString(trace_id))) AS traceId,
    lower(hex(parent_span_id)) AS parentId,
    lower(hex(span_id)) AS id,
    operation_name AS name,
    start_time_us AS timestamp,
    finish_time_us - start_time_us AS duration,
    cast(tuple('clickhouse'), 'Tuple(serviceName text)') AS localEndpoint,
    cast(tuple(
        attribute.values[indexOf(attribute.names, 'db.statement')]),
        'Tuple("db.statement" text)') AS tags
FROM system.opentelemetry_span_log
Enable tracing as you login with the clickhouse-client (Value between 0 (turned off) and 1 (100% of queries create trace))
clickhouse-client -h 127.0.0.1 --opentelemetry_start_trace_probability=0.1 --query_id "a0c9f73a1c684e0ce66333477a3841bf-200" --query "select 1"
clickhouse-client -h 127.0.0.1 --query "system flush logs"
The following type events will be pushed:
[{
 traceID: '97a156e95095e0e4c0f0f4dbb921244d',
 spanID: '19ce8d73f029e649',
 operationName: 'TCPHandler',
 references: [],
 startTime: '1641319910142576',
 startTimeUnixNano: 1641319910142576000,
 endTimeUnixNano: 1,
 duration: 12,
 tags: [ { key: 'db.statement', value: '', type: 'string' } ],
 logs: [],
 processID: 'p1',
 warnings: null,
 localEndpoint: { serviceName: 'clickhouse' },
 parentSpanID: '9654a4d5336d4c3e'
}]
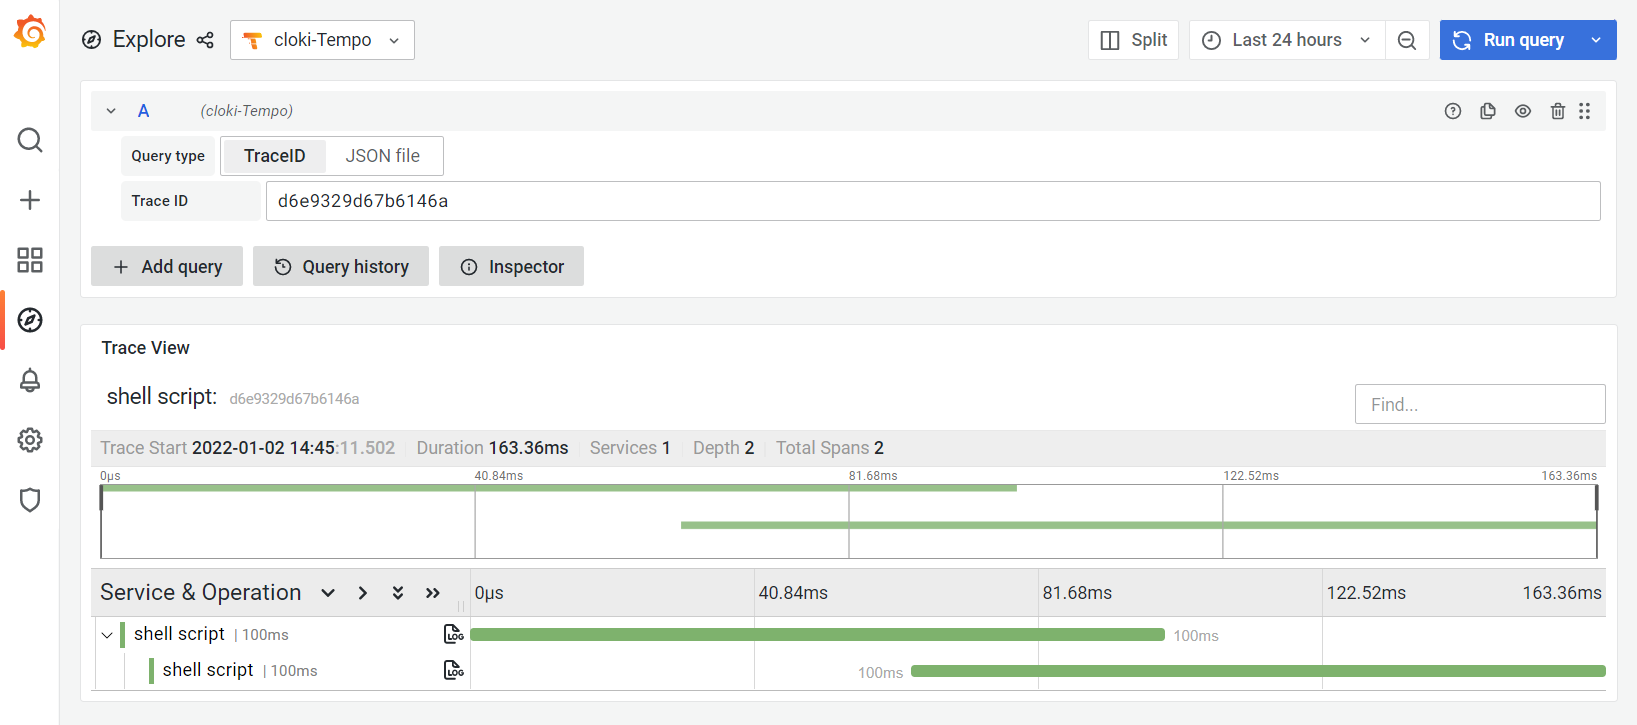
To setup a qryn datasource to interact between Tempo and qryn search please modify the datasource in Grafana and add the below derived field settings:

Your traces should now be appearing in Grafana as well as qryn using the {type="tempo"} tag

Since spans are also accessible as JSON Logs they can be used to power dashboard widgets through Loki datasources:
avg_over_time({traceId="a4040431298188d3c47a335f656f2350"} | json | unwrap duration[1s]) by (serviceName, operationName)
