React WebViews: Variable Viewer, Plot Viewer, and Data Viewer
The Jupyter Extension provides three different WebViews that are used for showing live Jupyter variables, saving and viewing of plots, and viewing of dataframe like objects.
The webviews that we host are based around a couple of base classes. These classes have both Panel and View versions. This is due to differences in the VS Code API for a webview hosted as a view (Data Viewer / Plot Viewer) and webviews hosted as a panel (Variable Viewer).
Webview => WebviewView / WebviewPanel The Webview class provides a light wrapper over the core VS Code webview classes. They handle loading the scripts for the view as well as generating the base HTML for the webview.
WebviewHost => WebviewViewHost / WebviewPanelHost The WebviewHost class is the base class that our viewers are built off of. Manages initialization and messaging of the actual webview.
The WebViews are built using a separate build process from the main extension compilation.

The base webpack file for viewer building is located here.
The initial implementation of notebooks in VS Code was all based on webviews which contained the full notebook UI in React + Redux for state management. The Plot Viewer and Data Viewer are both separate React controls that didn't participate in the full Redux store. When Variable Viewer was moved into a separate webview panel it maintained the Redux store from the old webview notebooks, so it maintains a lot of Redux overhead for providing its functionality.
The webview source files are all located in the webview/webview-side folder in the source tree.
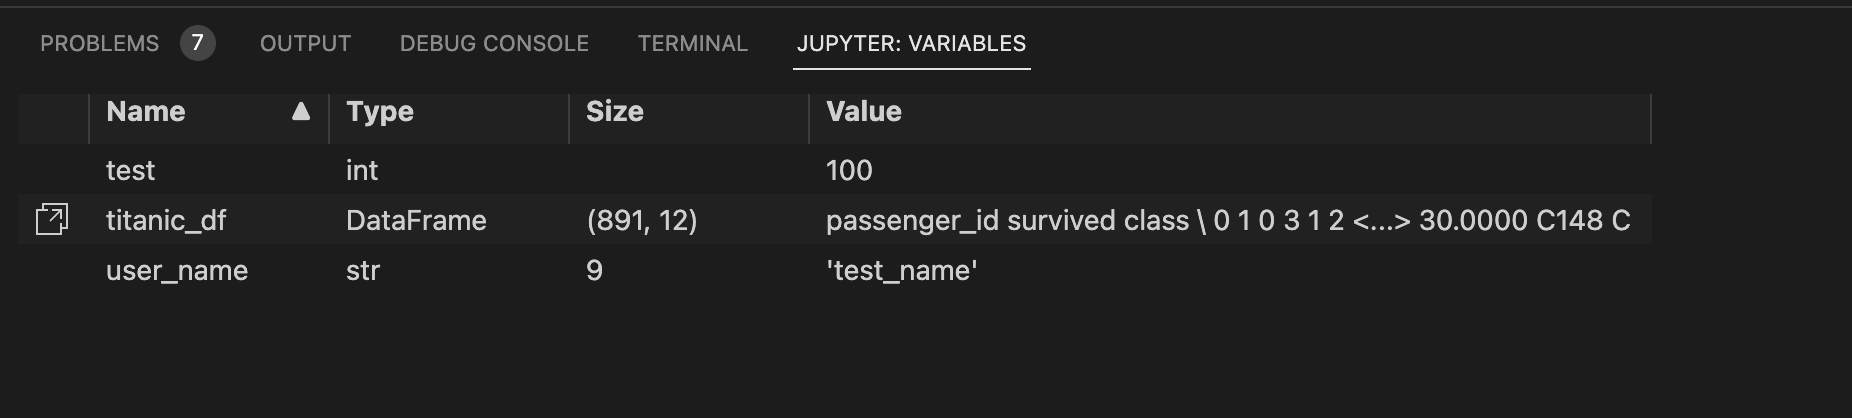
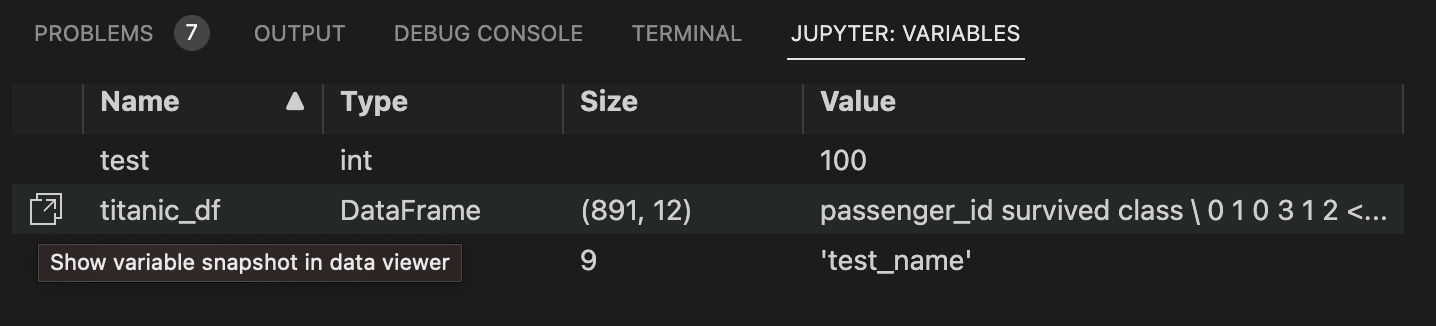
The variable viewer provides an overview of the current variables active in the Jupyter session. The view is hosted in a panel and will update when the current active notebook or interactive window is changes.
To get variables the variable view needs to call back to the extension side for getting variable values.
The flow of messages from the webview side can be best seen by looking at the handleRequest and handleResponse reducers. Note in these functions that the state needs to track both the current execution count and a refresh count that can be used to refresh the variable view even when the execution count remains the same.
The UI for the variable explorer is based around Adazzle react-data-grid seen here. Full variable count is fetched from the start, but variable values are pulled in in pages as the list is scrolled down.
When running a notebook plots in the output will have a button on the output to expand those images into the Plot Viewer. The Plot Viewer provides a more convenient place to pan / zoom / view / save images in associated notebooks.
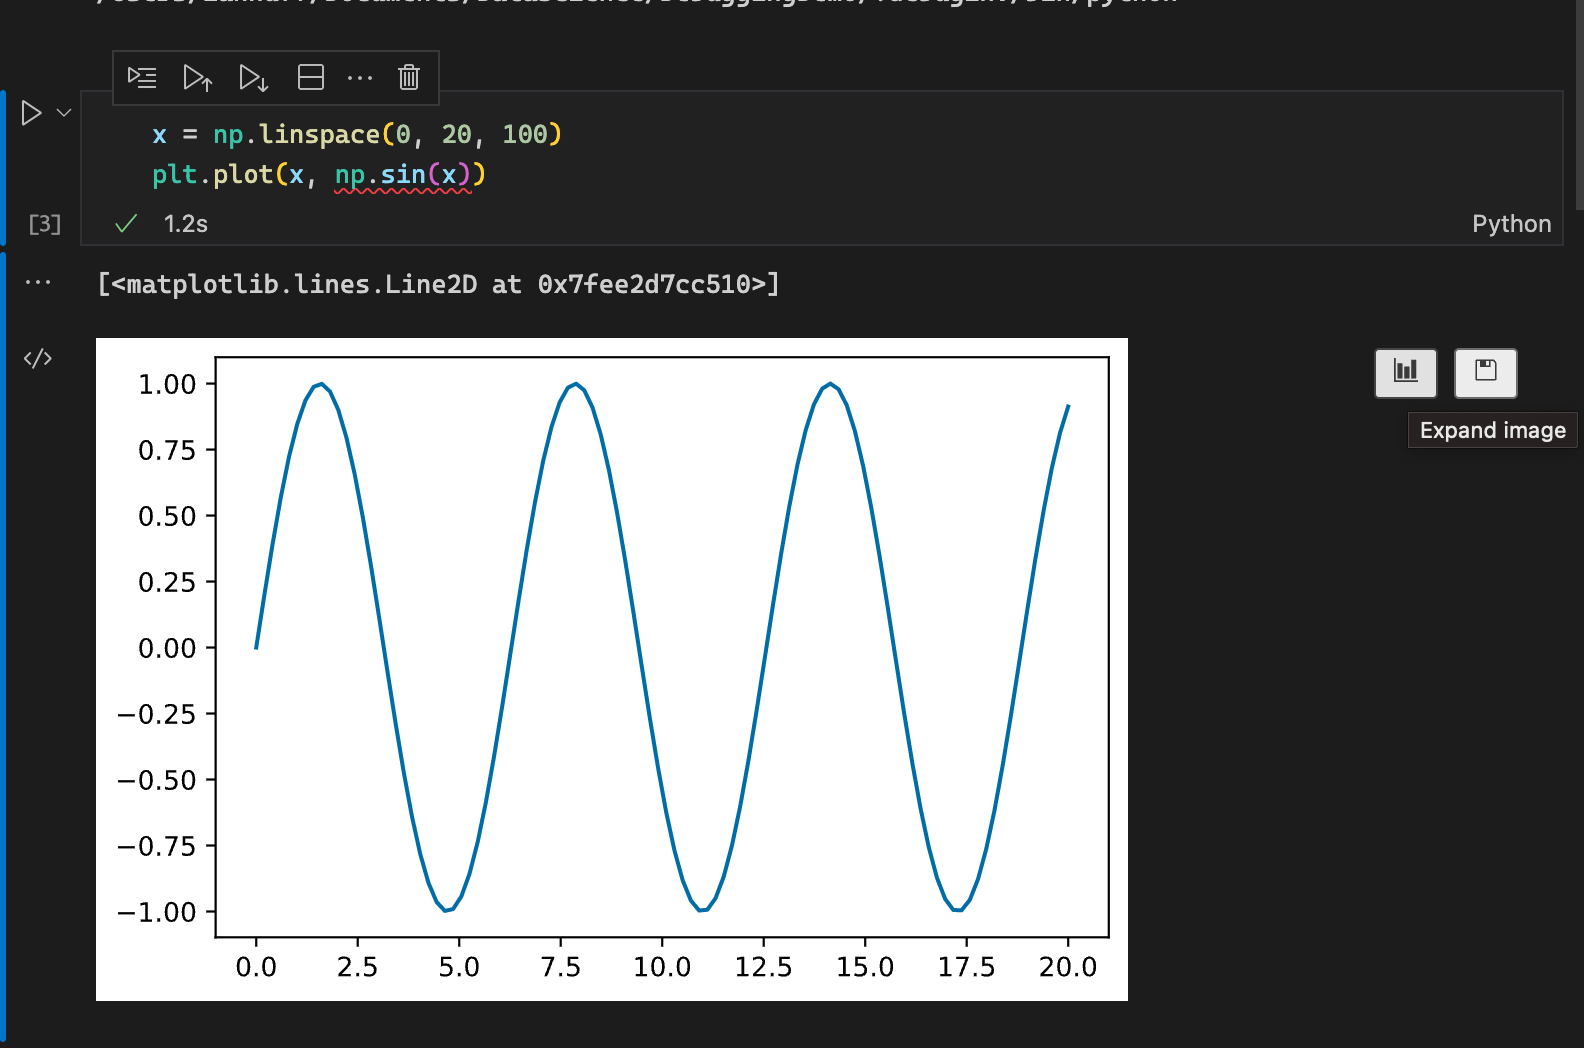
In kernel execution when output is detected as PNG or SVG a special attribute to indicate that this output is openable in the plot viewer is added here. This metadata ties back to the vscode-notebook-renderer extension which in render.tsx checks for this attribute and adds the icon to support opening in the plot viewer. When the button is clicked the renderer calls back to the extension to open that given output id in the plot viewer.
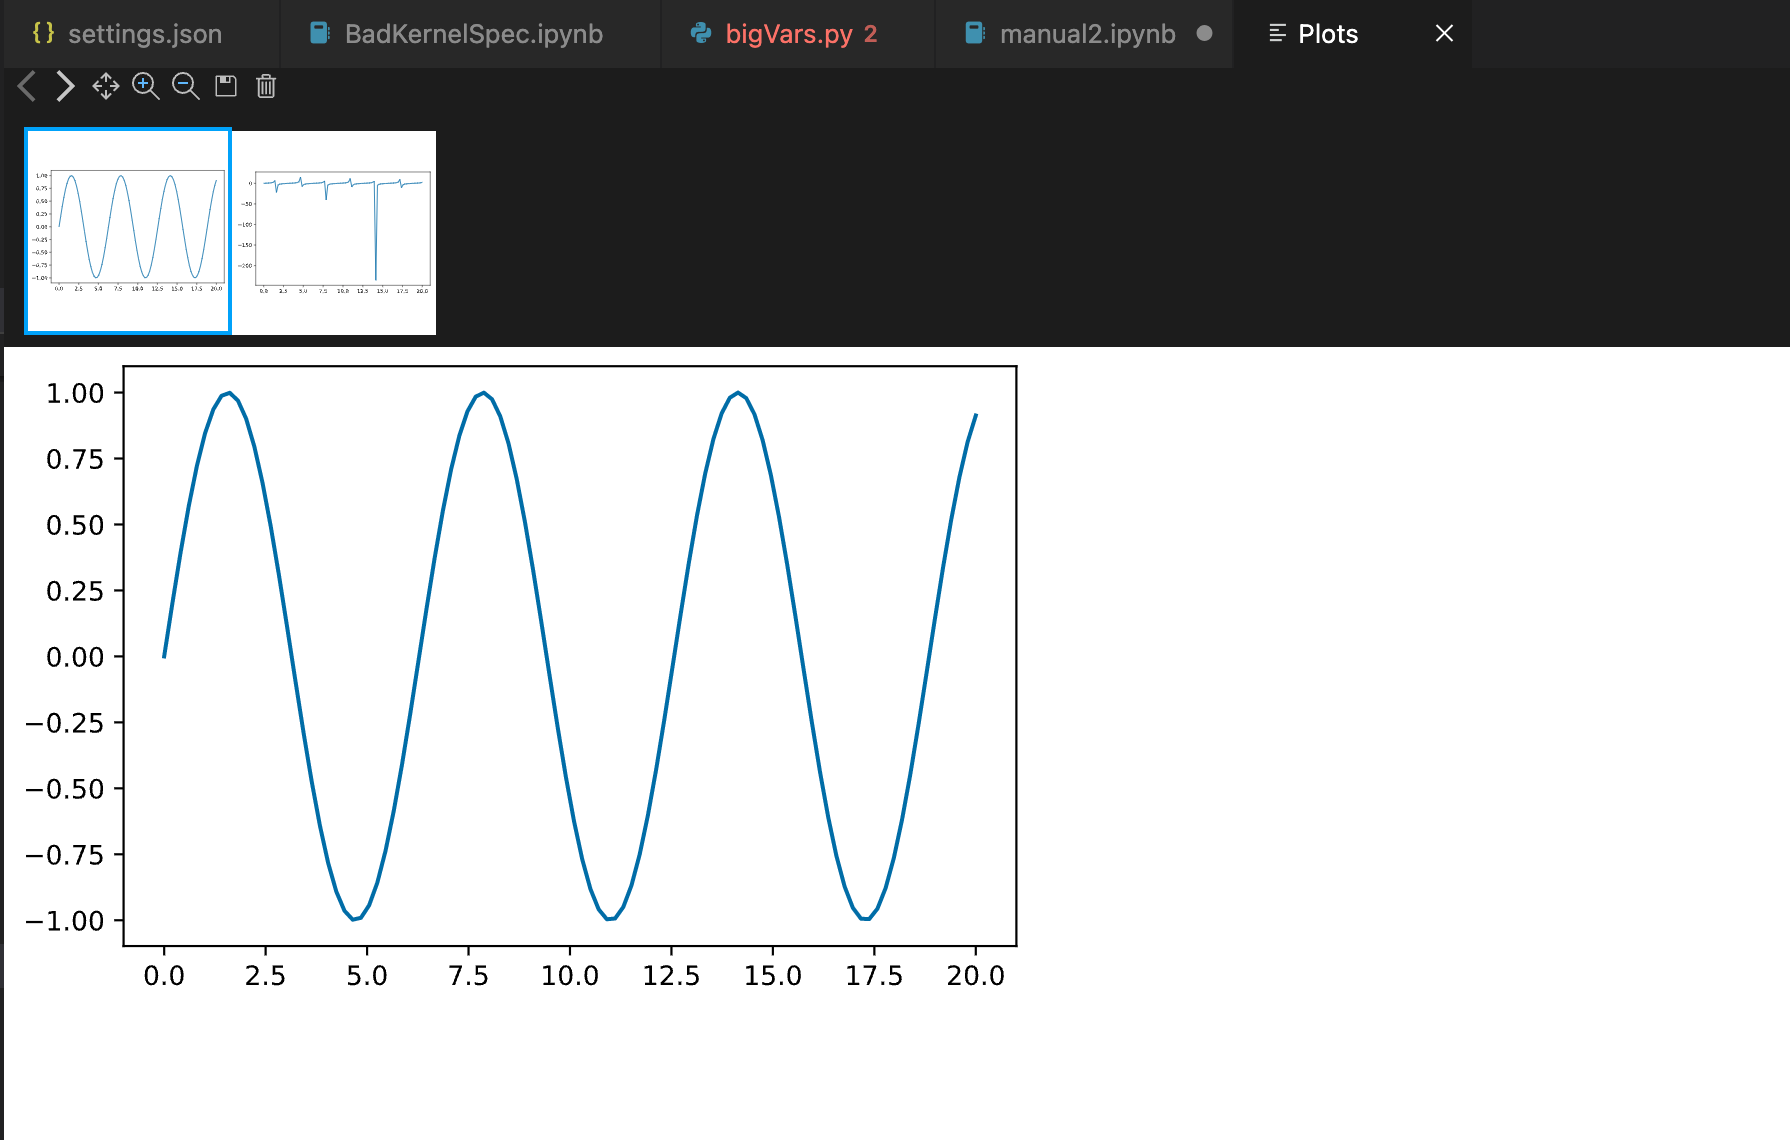
The Plot Viewer has two main UI components. The SvgList is the set of plot thumbnail selectors on the top of the control. And SvgViewer is the main control showing the selected plot along with controls for viewing. The plot control uses the npm components react-svgmt for SVG loading and react-svg-pan-zoom for the main viewer control.
The Data Viewer is a React control hosted in a webview that provides a way to view and filter dataframe like info.
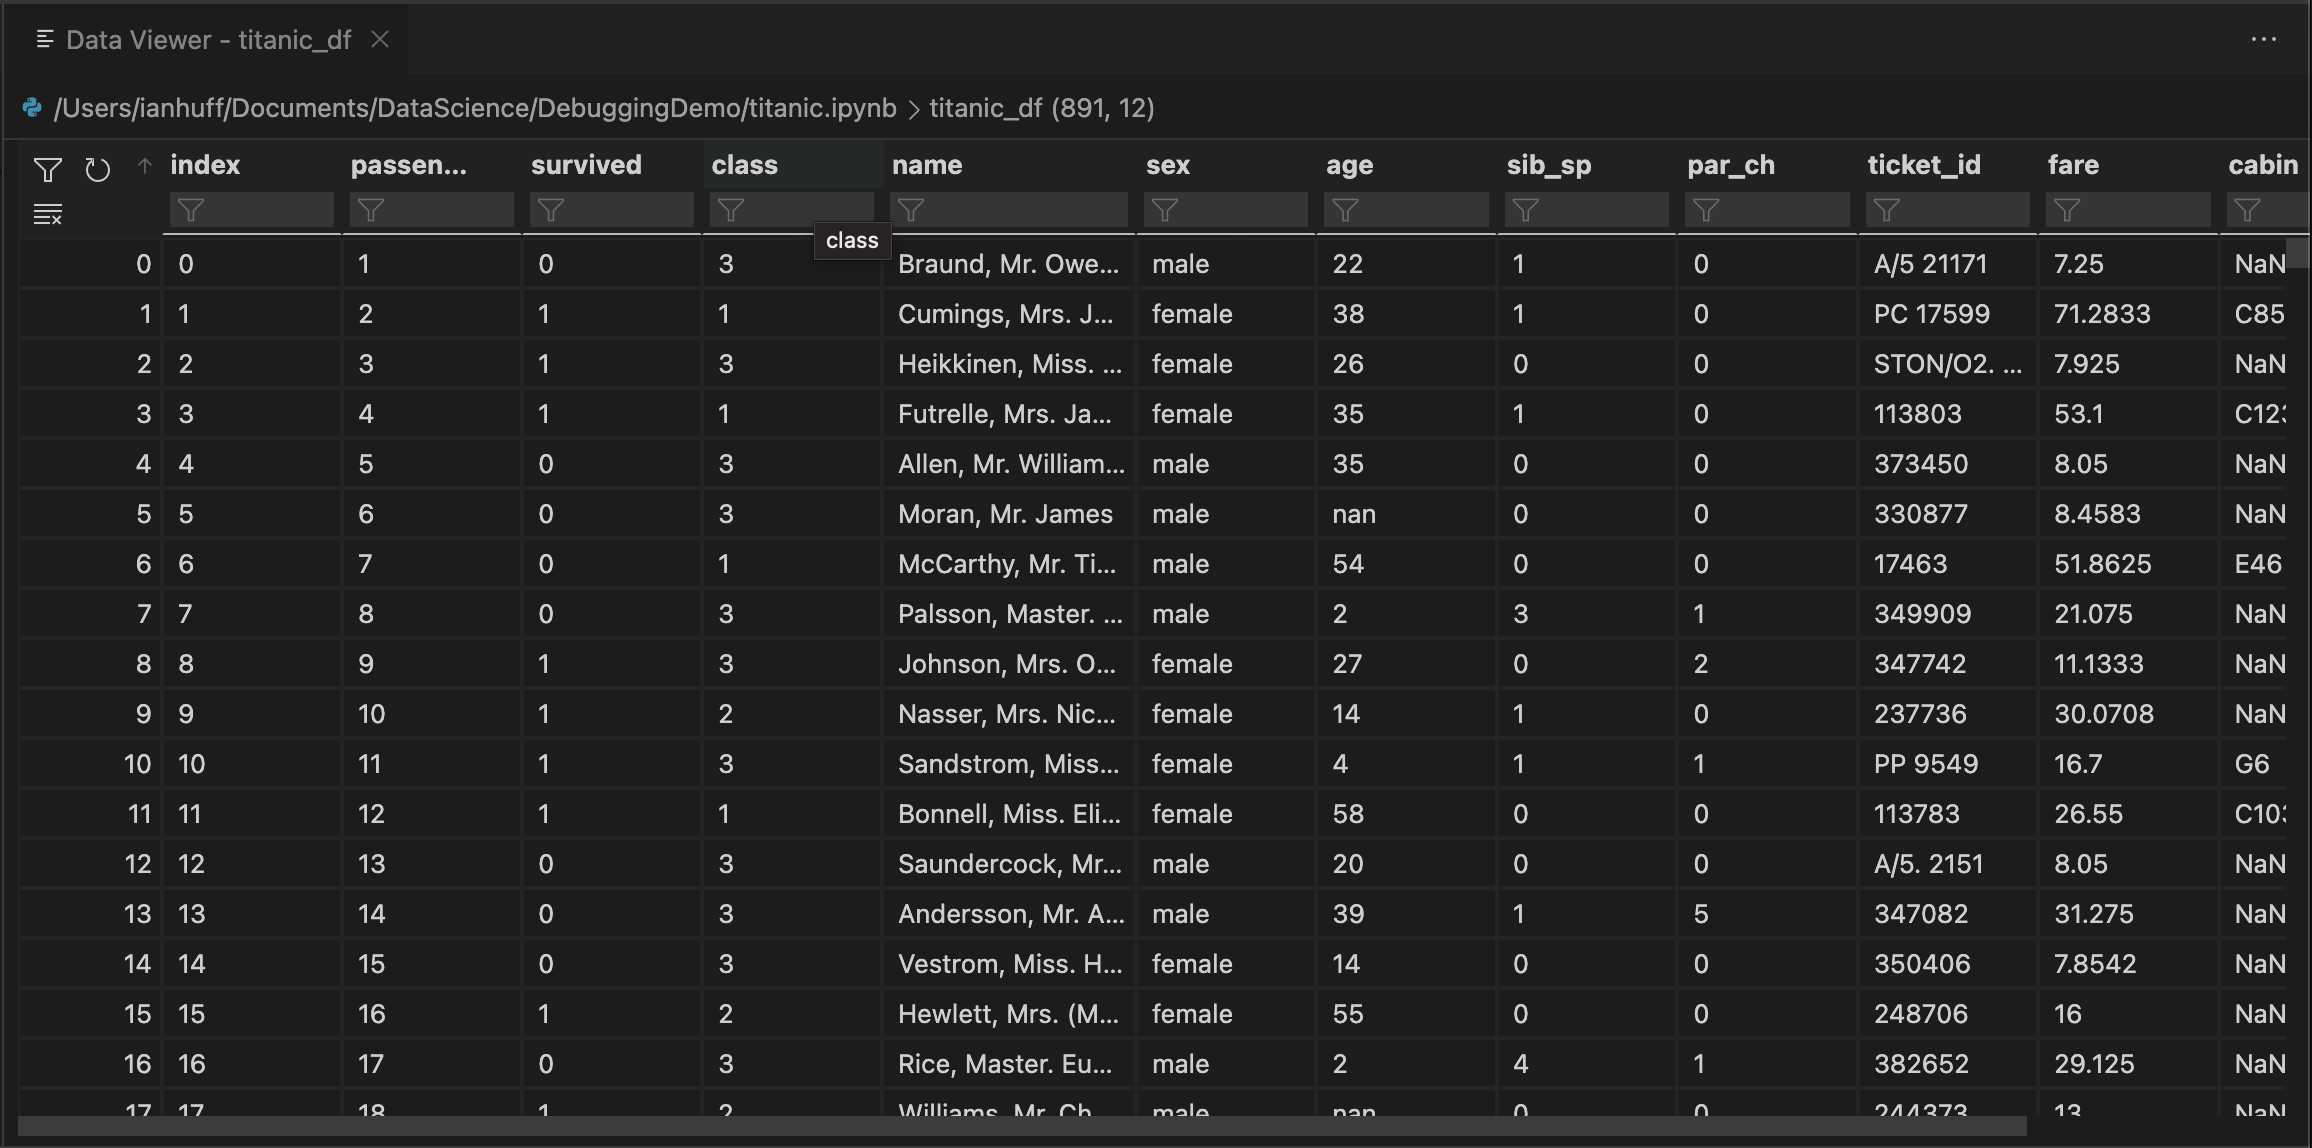
You can launch the data frame view from a value in the variable view or from the python debugger when debugging a .py file.
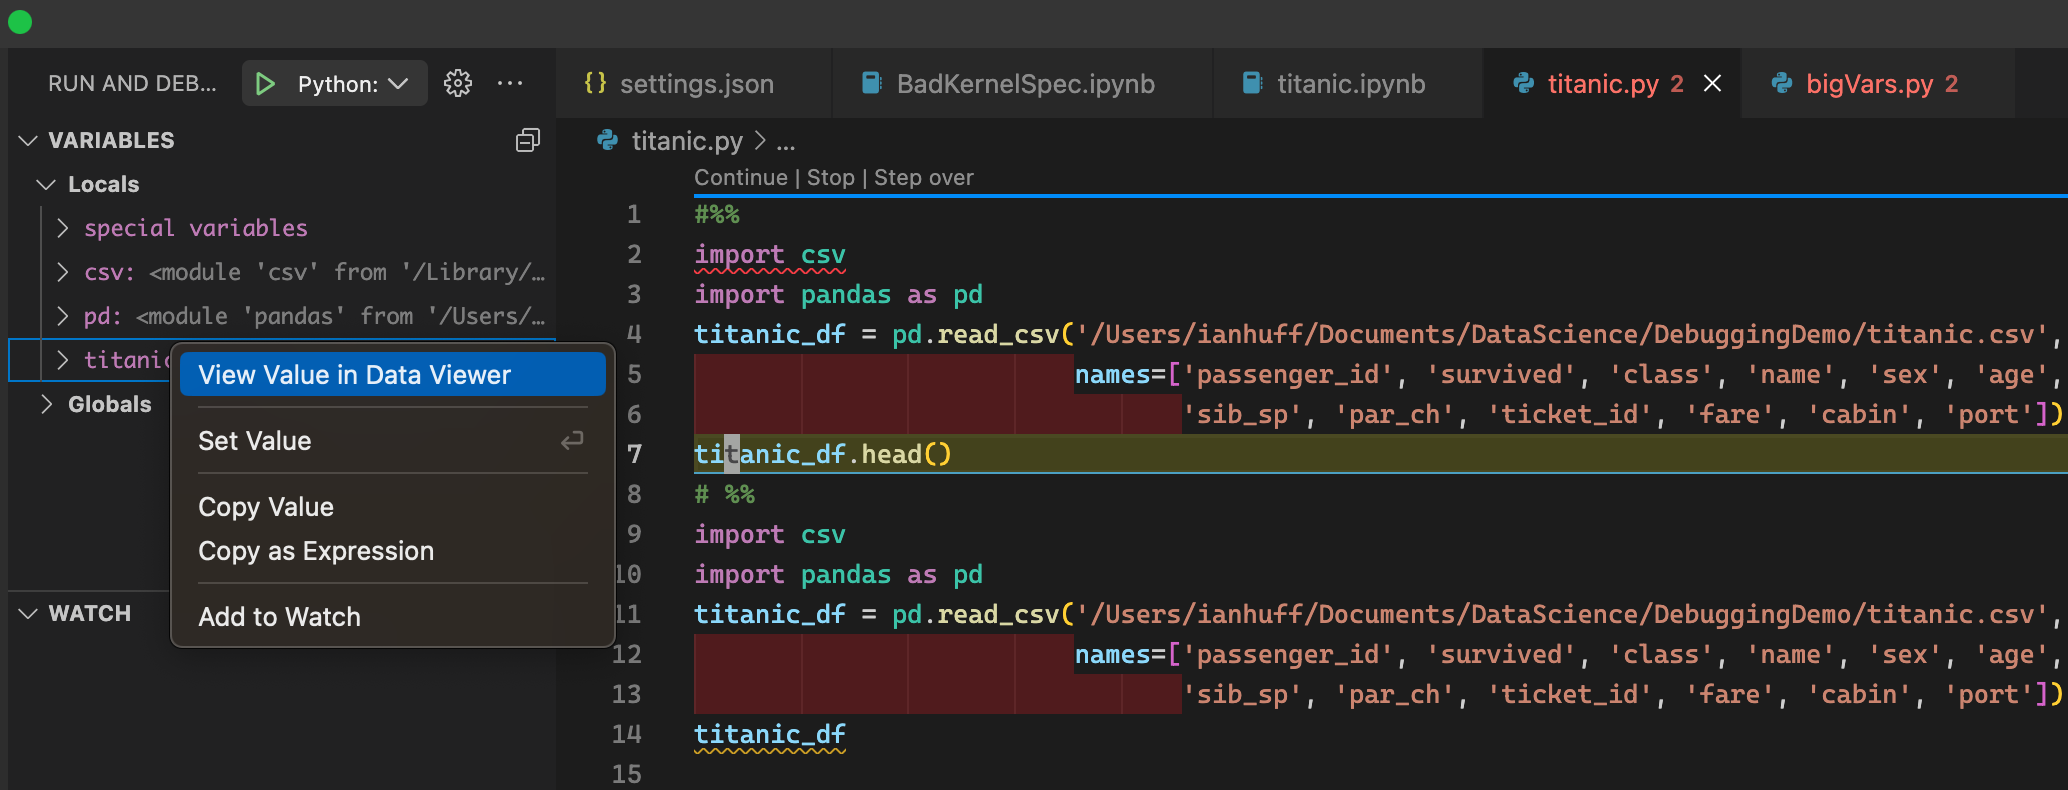
Note: The connection to the debug variables menu is a bit separate from normal extension flow. It's best tracked by starting from the debug variable menu contribution here.
The main control being used in the Data Viewer is the React slickgrid grid component. For larger dataframes the control can fetch data in chunks so the handler here is a good place to look at row chunk messages incoming from the extension side and being put into the grid rows. On the extension side you can see the matching function for fetching row chunks here in the JupyterVariableDataProvider. The slickgrid has a number of customizations for things like sorting / filtering and keyboard navigation contained in the reactSlickGrid.tsx file.