
- Introduction
- Project stages
- Dataset information
- Examining the relationship between current satisfaction and leaving the company
- The relationship between the number of projects completed by employees and leaving the company
- Average working hours per month according to the number of years working in the company
- Showing the number of people who left the company according to the length of time they worked in the company
- The proportion of those who left the company due to work disputes
- The relationship between the promotion of employees and their departure from the company
- The relationship between employees' salaries and their departure from the company
- The relationship of people's exit from the company to their job position
- Last word and conclusion
- Modeling
- Resources
The human resource management project was created for the purpose of analysis and modeling to predict the level of employee satisfaction and its effect on staying or leaving the company. In this project, according to the information collected from a large number of employees of different companies, I decided to measure the conditions of the employees and find their relation to staying or leaving the company. Finally, I will build a machine learning model that can predict which employees are due to leave the company. This model can be a very good management tool to help managers to create and improve company policies, so that finally employees are satisfied with working in the company.
This project consists of different stages that you can see by referring to the above menu. I will explain all these steps completely.
This data set is a large data set consisting of information needed to measure the status of employees and manage human resources. You can click here to access the download link and description of the dataset from the reference site.
This dataset has 14,999 records of information from different employees in the form of 10 columns that contain specific variables.
The dataset named dataset.csv is stored in the main directory of the repository. You can click here to access it.
| Row | Column | Description | Type |
|---|---|---|---|
| 1 | satisfaction_level | Current level of employee satisfaction. | Float |
| 2 | last_evaluation | The score of the last job evaluation. | Float |
| 3 | number_project | The number of projects that the employee has done. | Integer |
| 4 | average_montly_hours | Average working hours per month. | Integer |
| 5 | time_spend_company | The number of years the employee has been in the company. | Integer |
| 6 | Work_accident | Has the employee had a work dispute or not? | Binary (0, 1) |
| 7 | promotion_last_5years | Has the employee been promoted in the last 5 years or not? | Binary (0, 1) |
| 8 | sales | Job position | String |
| 9 | salary | Employee's salary | String (low, medium, high) |
| 10 | left | Has the employee left the company or not? | Binary (0, 1) |
 With the help of this chart, we can understand the relationship between the
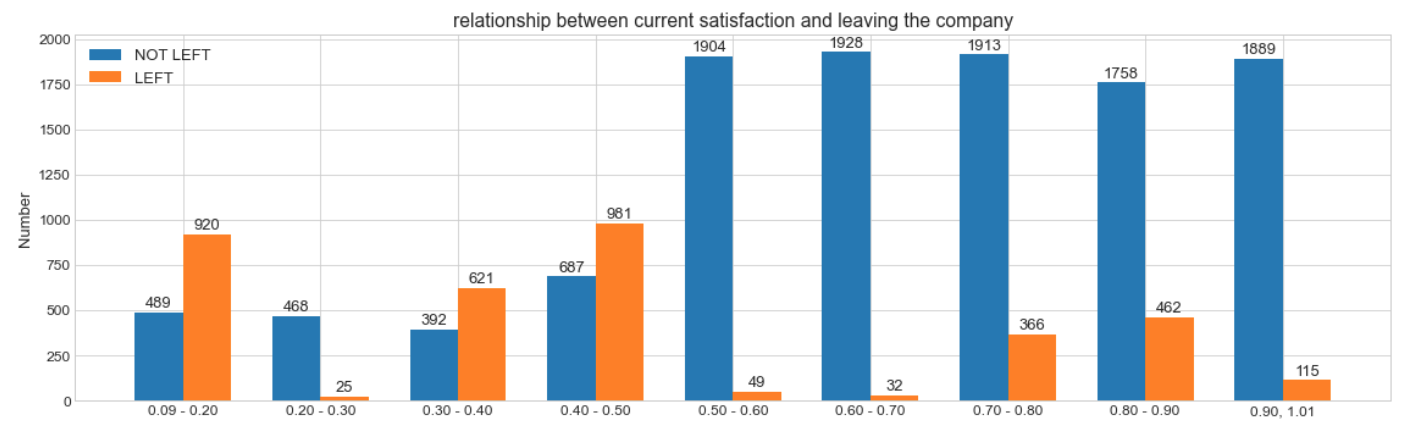
 current level of employee satisfaction and whether they stay or leave the company.
As you can see, the lower the level of employee satisfaction, the more likely employees are to leave, which is logical. But when you look carefully, you will see that when the level of employee satisfaction is high, the rate of their leaving the company is not low. This indicates that maybe other things even make an employee leave his company if he is very satisfied with his work.
Also, the important point is that those who have normal or average satisfaction with their work will most likely stay in the company.
 This chart measures the relationship between the
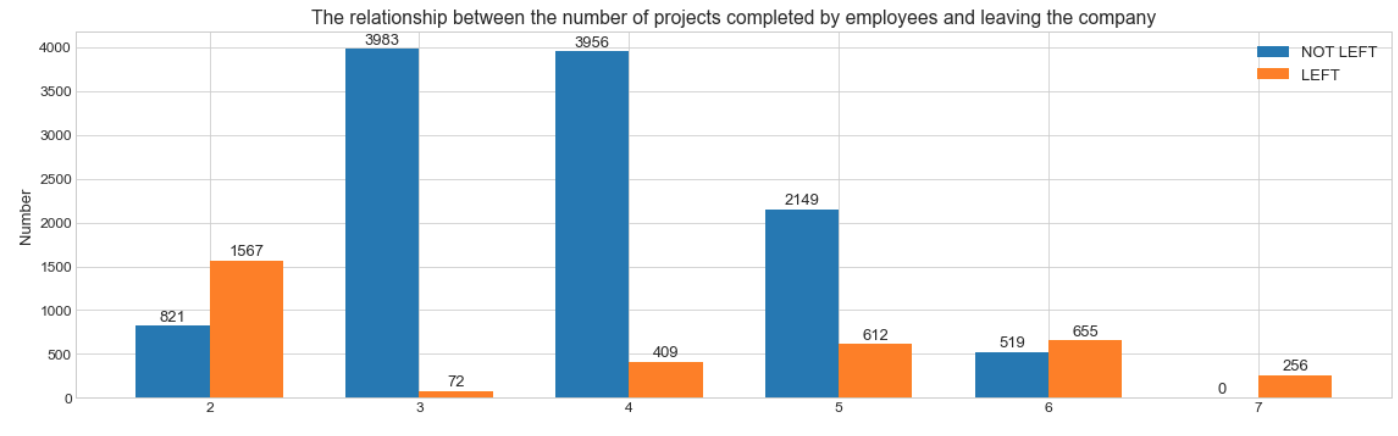
 work projects that employees have done and their decision to leave the company.
As you can see, employees who are involved in fewer projects are more likely to leave the company, which can be due to the monotony and non-challenge of their work.
Also, employees who are involved in more projects are likely to be tired of their work due to high pressure and find less satisfaction with their jobs.
 In this chart, we measure the
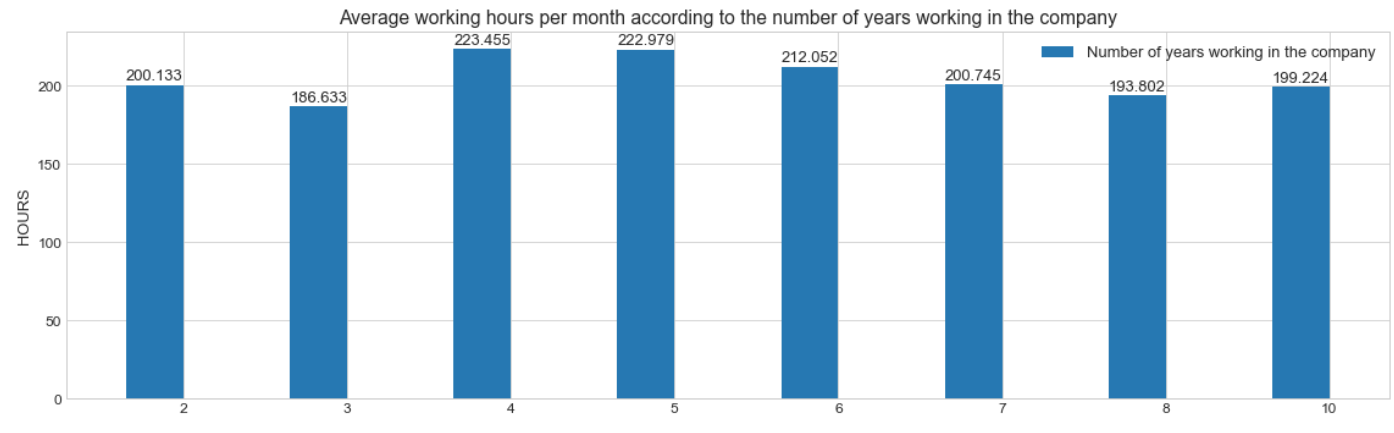
 average working hours of employees per month in relation to the number of years they have been in the company.
As it is known, the employees who are in the middle of this chart and have been in the company for an average of 4 to 6 years work more than new or experienced employees.
Showing the number of people who left the company according to the length of time they worked in the company
 Now this diagram gives us a better explanation.
In this chart, we
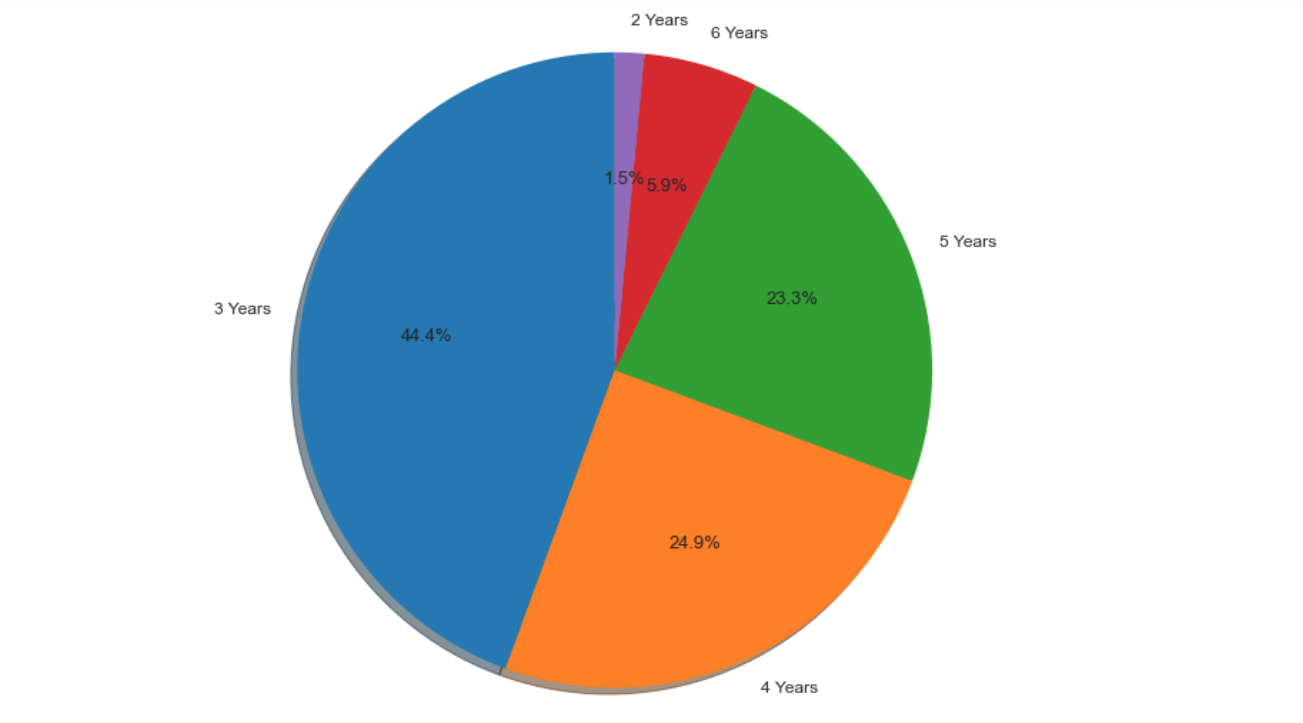
Now this diagram gives us a better explanation.
In this chart, we classify the people who left the company by the number of years they have been in the company. The result tells us the same thing as the previous chart. More employees leave companies that have more work pressure and work more. But wait, need to check more.
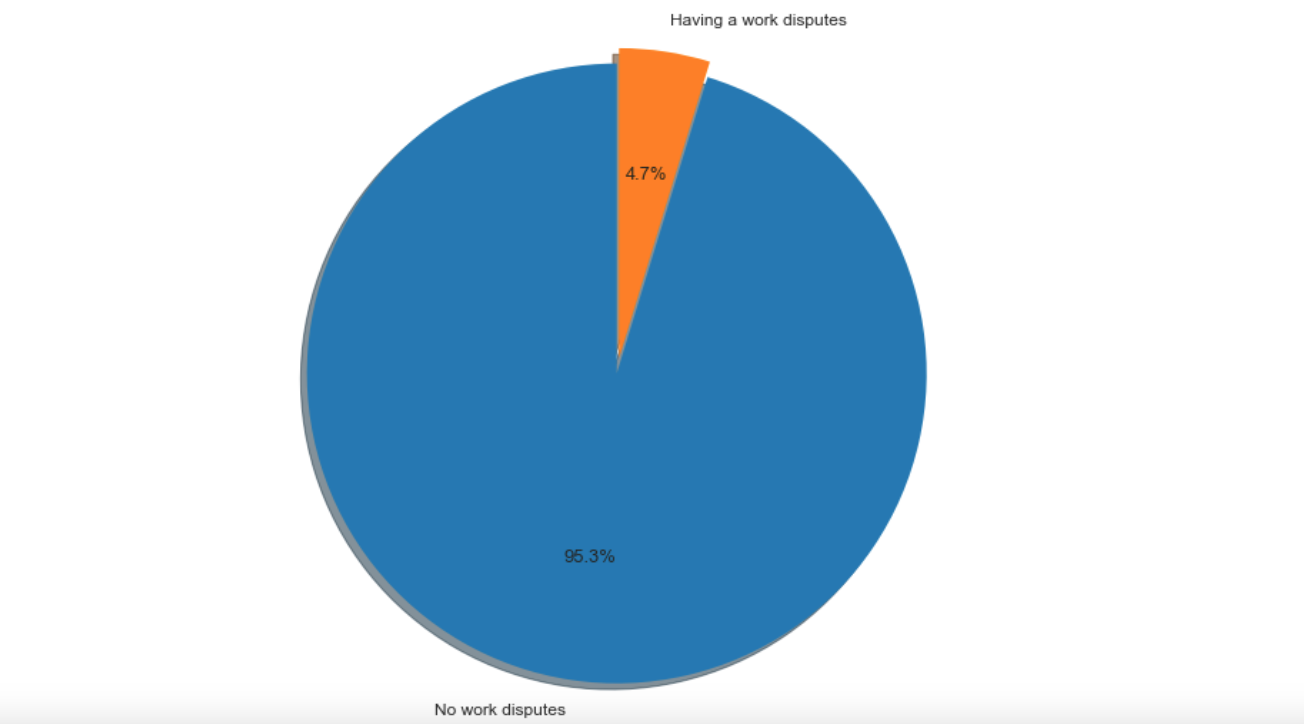 Contrary to expectations, this chart shows us that a
 small number of people who had a conflict at work left the company, and most people probably decided to leave the company for other reasons.
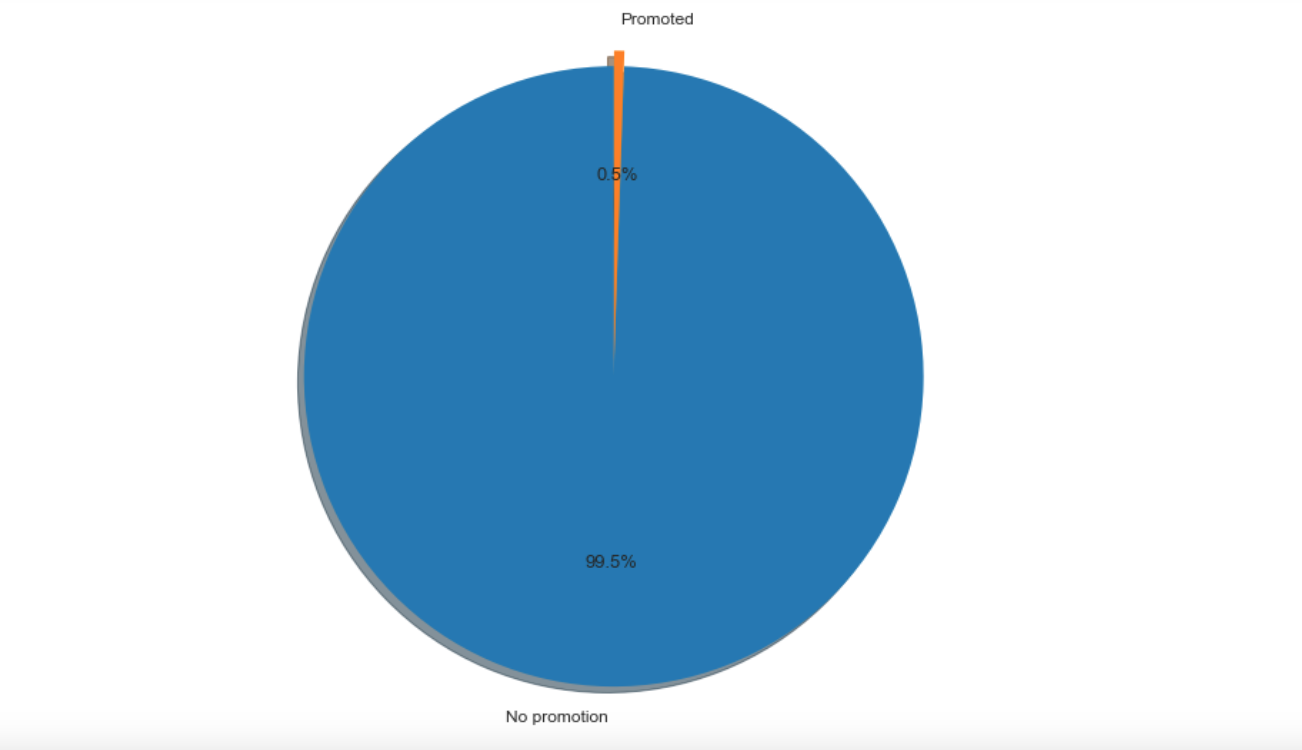 Now we understand more. According to the previous information, it is clear that most of the people who leave the company probably have a lot of
 work pressure on their shoulders and do not get proper promotion! This makes them not feel progress and not satisfied with their work.
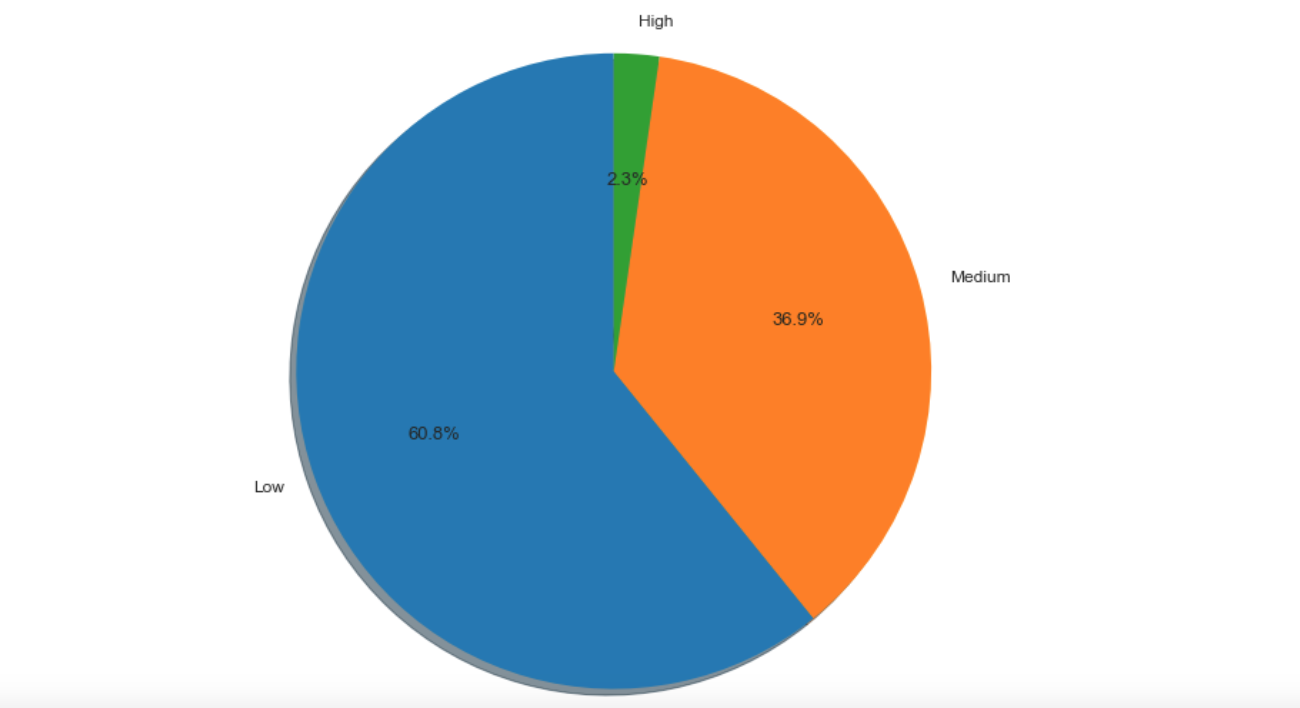 Now even this becomes more understandable.
The employees who leave the company not only experience a
Now even this becomes more understandable.
The employees who leave the company not only experience a lot of work pressure, but they don't even get any promotion, and of course, most importantly, they receive low salaries.
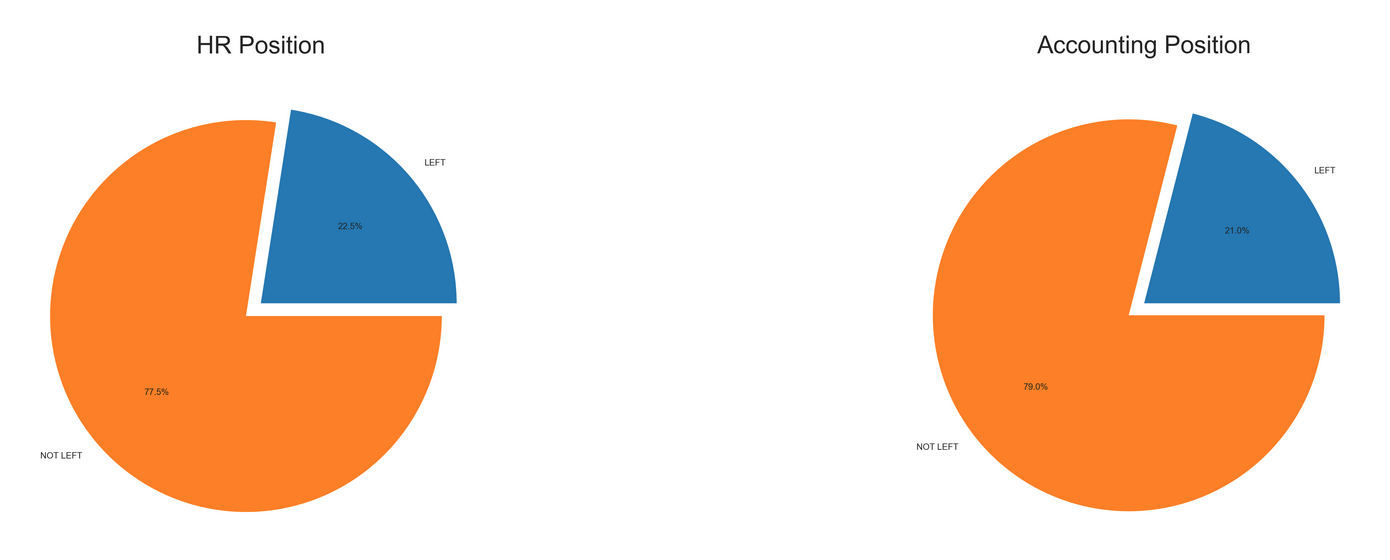
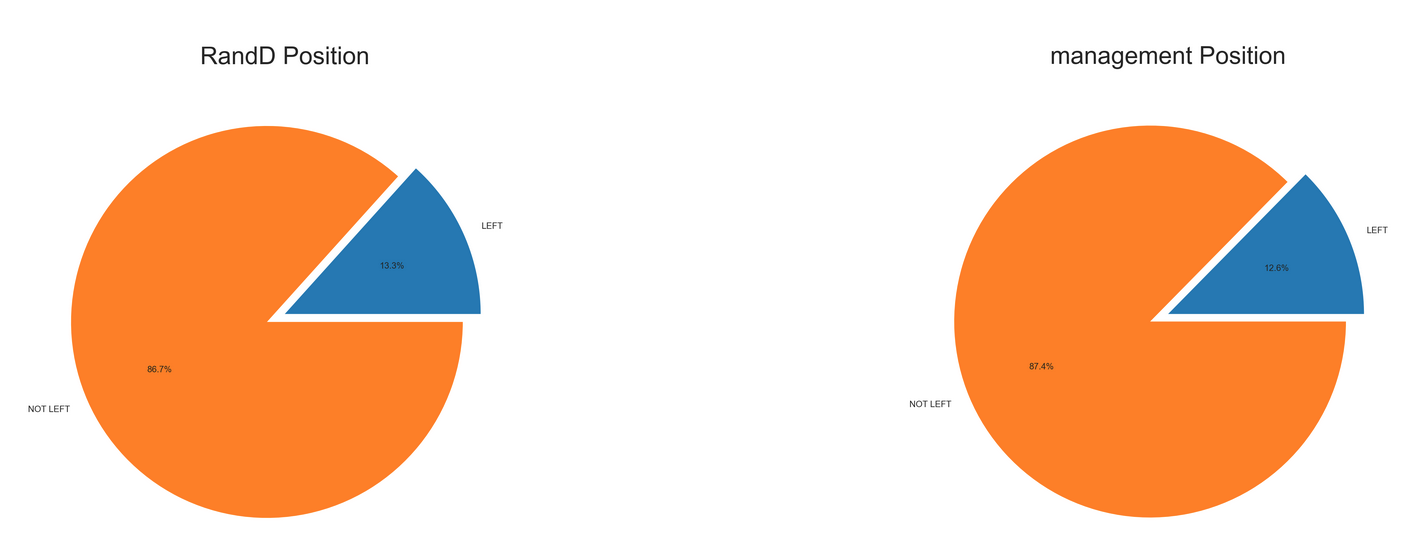
You can even classify different job positions.
As it is known, the lowest level of satisfaction that leads to leaving the company belongs to accounting and human resources job positions.
And of course, the highest level of satisfaction is related to management and RandD job positions.
Finally, looking at the data and charts that we reviewed, we come to the conclusion that the most important reason for employees to leave the company is excessive work pressure, not getting promotion and low salaries compared to the volume and difficulty of work. Especially in job positions such as human resources and accounting, where the form of work is directly related to people and their complex relationships and numbers and accounting, this dissatisfaction is more. Instead, there is more satisfaction among employees in managerial positions due to less pressure and higher salaries. Another important factor is dynamism and interesting work challenges. Employees who leave the company are likely to suffer from the monotony of their work and do not feel useful. This can be seen from the job positions that have the most dissatisfaction.
In this part, I am going to explain the steps of building a machine learning model whose job is to predict employee satisfaction and check the possibility of them leaving the company.
The first step is data pre-processing.
In this step, we need to clean the data and prepare it to teach our model.
Fortunately, our data set is very clean and with a few small tasks we can prepare our data for our modeling. This increases the speed of our work because we are not going to deal with missing values and outlier data.
Our machine learning model can only process numbers. For this reason, we need to convert our non-numerical data into numbers.
We start this with the job positions field and use a method called one-hot. Click here to learn more about this method.
In the following, we use the replacement method to convert the salary field into a numerical type. In this way, we categorize salaries from zero to two:
low    ->  0
medium ->  1
high   ->  2
After that, we separate the label, which is the field specifying the status of leaving the company, from the dataset.
Then, by separating training and test data, we prepare our data for modeling. This is done to prevent cheating during learning. We will train our model with training data and then test it with test data to evaluate the performance of the model.
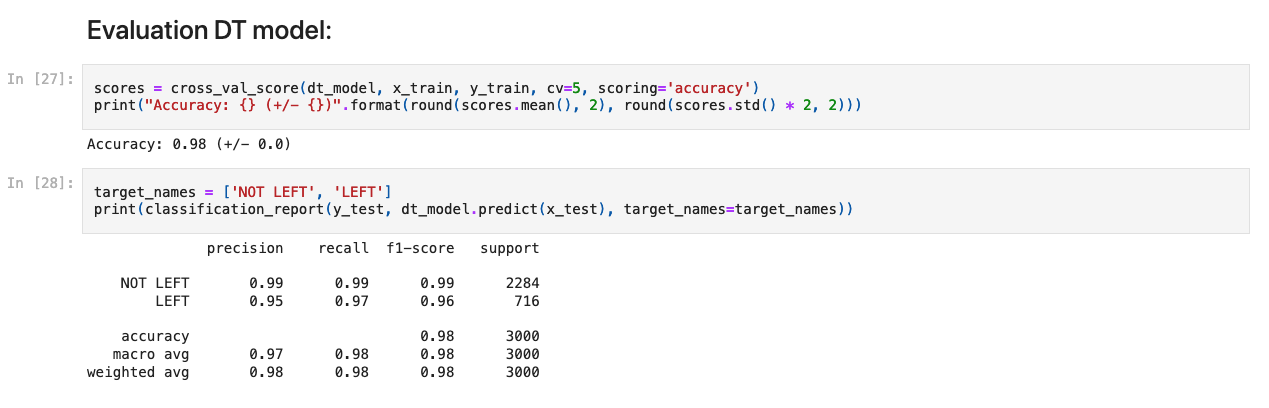
After that, we make different models by different classification algorithms and measure the accuracy of each one in prediction. Here I used common algorithms such as KNN, decision tree and neural network and measured the accuracy of each one separately. In the end, the decision tree algorithm performed better in this project and will have a correct prediction with an accuracy of nearly 98%.
Then we save the final model with the help of the pickle module in Python so that in the future we can load it in different projects that are compatible with our model and use its predictions.
Finally, we load the final model and give it new information about the employees to measure the prediction result according to the new information.
Example1:
'''
satisfaction_level = 0.30
last_evaluation = 0.50
number_project = 5
average_montly_hours = 250H
time_spend_company = 5Y
Work_accident = NO
promotion_last_5years = NO
job_position = IT
'''

exm1 = hrm_model.predict([[0.30, 0.50, 5, 250, 5, 0, 0, 2, 1, 0, 0, 0, 0, 0, 0, 0, 0, 0]])
print('NOT LEFT' if exm1 == 0 else 'LEFT')
Output:
NOT LEFT
Example2:
'''
satisfaction_level = 0.30
last_evaluation = 0.20
number_project = 2
average_montly_hours = 210H
time_spend_company = 3Y
Work_accident = YES
promotion_last_5years = NO
job_position = Management
'''

exm2 = hrm_model.predict([[0.30, 0.20, 2, 210, 3, 1, 0, 1, 0, 0, 0, 0, 1, 0, 0, 0, 0, 0]])
print('NOT LEFT' if exm2 == 0 else 'LEFT')
Output:
NOT LEFT
Example3:
'''
satisfaction_level = 0.10
last_evaluation = 0.10
number_project = 3
average_montly_hours = 170H
time_spend_company = 2Y
Work_accident = NO
promotion_last_5years = NO
job_position = HR
'''

exm3 = hrm_model.predict([[0.10, 0.10, 3, 170, 2, 0, 0, 0, 0, 0, 0, 1, 0, 0, 0, 0, 0, 0]])
print('NOT LEFT' if exm3 == 0 else 'LEFT')
Output:
LEFT
This dataset was obtained from this link: http://dataheart.ir/article/3475/%D8%AF%DB%8C%D8%AA%D8%A7%D8%B3%D8%AA-%D9%85%D8%AF%DB%8C%D8%B1%DB%8C%D8%AA-%D9%85%D9%86%D8%A7%D8%A8%D8%B9-%D8%A7%D9%86%D8%B3%D8%A7%D9%86%DB%8C