Perfect Pitch for Anyone.
Aposynthese converts mp3 files into piano visualizations, giving the user the ability to learn any song they like. It works by decomposing the song's underlying constituent frequencies with the Short Time Fourier Transform (STFT), and mapping dominant frequencies to real piano notes across time. The program also leverages some advances Music Information Processing techniques, like Harmonic-Percussive Source Separation (HPSS) to remove drum beats and iterative cosine similarity to remove vocals. Additional custom signal processing cleans up the STFT spectrograms and allows smoother tonality mapping that mimics the human ear.
Before you you ask, Aposynthese is Greek for "Decomposition".

pip install -r requirements.txt(>=Python3.6)npm init- Ensure
ffmpegis installed and added to your PATH.
python audio_to_piano.py [OPTIONS]
-h, --help      Print this help text and exit.
-s, --song      Name of the song in assets/ to transpose          default=None, type=str
-y, --youtube   URL of youtube video to transpose                 default=None, type=str
-m, --max_time  Time to process audio file until                  default=None, type=int
-p, --plot      Whether to plot the spectrograms for debugging    default=False, type=bool
npm start
Port defaults to 80. Visit http://0.0.0.0:80 and enter a valid YouTube URL.
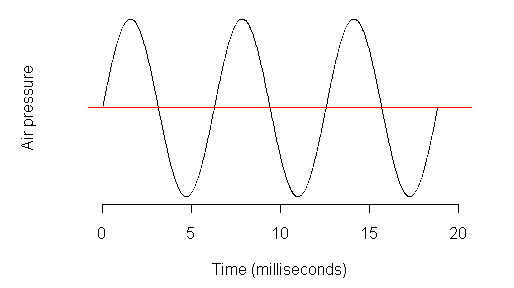
Sound is a time signal: in the physical world, sound is how we interpret pressurve waves propogating through air over time. Digitially, this is represented as an array, where the values represent the amplitude of the wave and the index is the time point.
If we want to extract the musical notes from a song, we need to know which frequencies are resonating at a each time point. The Fourier Transform is the mathematical operation used to do this. It translates a time signal into a frequency signal, and allows us to separate those frequncies from one another. A spectrogram is a flavor of the FFT, where the operation is performed iteratively across time, which generates a high resolution plot like the one shown below of a song file. The x-axis is time, the y-axis is frequency, and the color (or z-axis) is the relative intensity of that frequency/time point. Yellow is a higher intensity while blue is lower.

This plot allows us to visualize sound. The vertical lines we see are short, stacatto, probably percussive notes being played, while the horizontal lines are sustained harmonic tones. We can leverage these features to analyze the music piece as a whole.
We iterate through this spectrogram plot across time, and apply peak detection at each spectral time vector. Any peaks are the dominant frequencies at this tome point. Note that a dominant frequency is not necessarily a note being played by an instrument. The reason is that a note of an instrument (and most sound in general) consists of many overtones and harmonics at once. This is why a piano will sound different to a violin. While this may present a problem in terms of accurately depicting only the true notes being played, one can also see these active overtones in Aposynthese's visualization as a way to add richness to the sounds they create as musicians.
We take these dominant frequencies and map them to notes on a music scale. Below the plot shows a fourier transform (FFT) performed at a given time point, with peak detection applied. The piano shows the detected dominant frequencies mapped onto the keys.

If this pipeline is applied across all time points, we can generate a video like this! Click the gif for a sample video :)
In addition to this base-level signal processing, we can add additional techniques from the field of Music Information Processing to clean up our spectrograms and generate higher accuracy piano visualizations. Specfically, Aposynthese uses two cutting edge techniques: Harmonic-Percussive Source Separation (HPSS), and vocal separation, so that only the harmonic tones derived from instrumentation is left.
HPSS leverages the fact that percussive sounds appear as vertical segments in the spectrogram, while harmonic tones sustain along the horizontal axis. One can create masks of the spectrogram which respond most to both horizontal and vertical components, respectively, using median filters. You can read more about HPSS in librosa's implementation of it.

Vocal separation can be accomplished using a similar technique. While instrumentation can be seen as straight lines, vocals can be seen in the spectrogram curves. We can separate the vocals (foreground) out by comparing frames of the spectrogram across time, using cosine similarity, and suppressing sparse/non-repetetitive components. The repetitive components are understood to be the rhythms of the music, where as vocals change more over time. From this, you can use masks to separate the two components. Again, see librosa's implementation for specifics.

-
Müller, Meinard. Fundamentals of Music Processing: Audio, Analysis, Algorithms, Applications. Springer, 2015.
-
Harmonic/Percussive Separation Using MedianFiltering - Fitzgerald, 2010 PDF link
-
Music/Voice Separation Using the Similarity Matrix, Rafii and Pardo, 2012 PDF link
- use iterative FFT to avoid matrix multiplcation memory error
- Docker for automated deployment
- modularize nodejs code
- improve threshold peak detection (...dynamically?)
- play with or automate parameters in
scipy.signal.find_peaks
- play with or automate parameters in
- chord detection
- write tests