

![]()
COG(Cluster of Orthologous Genes) is a database that plays an important role in the annotation, classification, and analysis of microbial gene function. Functional annotation, classification, and analysis of each gene in newly sequenced bacterial genomes using the COG database is a common task. However, there was no COG functional classification command line software that is easy-to-use and capable of producing publication-ready figures. Therefore, I developed COGclassifier to fill this need. COGclassifier can automatically perform the processes from searching query sequences into the COG database, to annotation and classification of gene functions, to generation of publication-ready figures (See figure below).
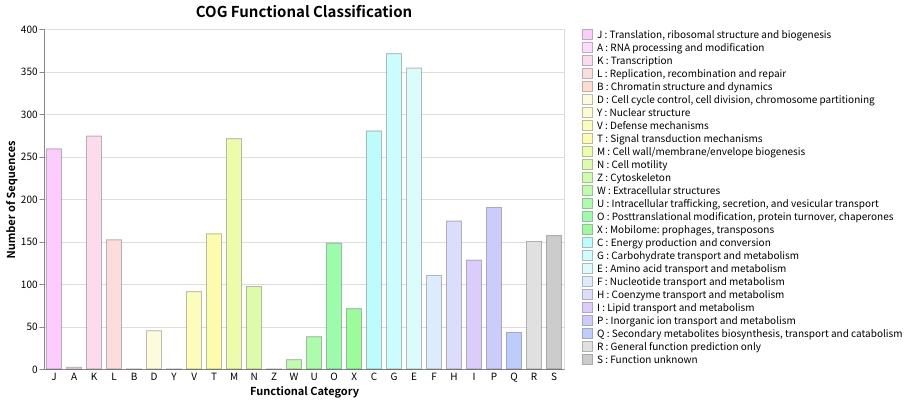
Fig.1: Barchart of COG funcitional category classification result for E.coli
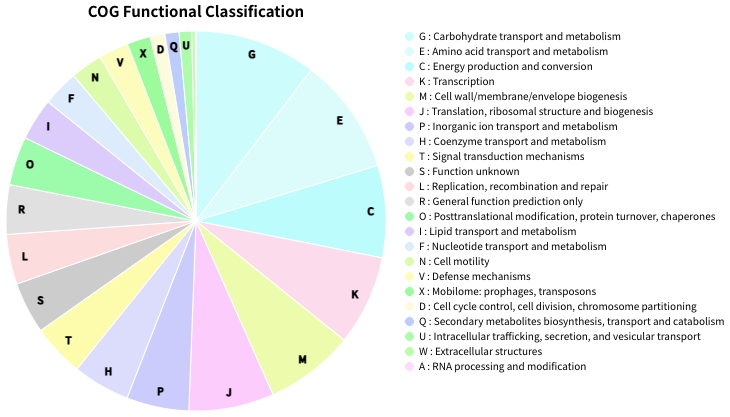
Fig.2: Piechart of COG funcitional category classification result for E.coli
COGclassifier is implemented in Python3. RPS-BLAST(v2.13.0) binary is bundled in COGclassifier (src/cogclassifier/bin).
Install bioconda package:
conda install -c conda-forge -c bioconda cogclassifier
Install PyPI stable package:
pip install cogclassifier
Description of COGclassifier's automated workflow. This workflow was created based in part on cdd2cog.
Download 4 required COG & CDD files from FTP site.
-
fun-20.tab(https://ftp.ncbi.nih.gov/pub/COG/COG2020/data/fun-20.tab)
Descriptions of COG functional categories.Show more information
Tab-delimited plain text file with descriptions of COG functional categories
Columns:1. Functional category ID (one letter)
2. Hexadecimal RGB color associated with the functional category
3. Functional category description
Each line corresponds to one functional category. The order of the categories is meaningful (reflects a hierarchy of functions; determines the order of display)(From https://ftp.ncbi.nih.gov/pub/COG/COG2020/data/Readme.2020-11-25.txt)
-
cog-20.def.tab(https://ftp.ncbi.nih.gov/pub/COG/COG2020/data/cog-20.def.tab)
COG descriptions such as 'COG ID', 'COG functional category', 'COG name', etc...Show more information
Tab-delimited plain text file with COG descriptions
Columns:1. COG ID
2. COG functional category (could include multiple letters in the order of importance)
3. COG name
4. Gene associated with the COG (optional)
5. Functional pathway associated with the COG (optional)
6. PubMed ID, associated with the COG (multiple entries are semicolon-separated; optional)
7. PDB ID of the structure associated with the COG (multiple entries are semicolon-separated; optional)
Each line corresponds to one COG. The order of the COGs is arbitrary (displayed in the lexicographic order)(From https://ftp.ncbi.nih.gov/pub/COG/COG2020/data/Readme.2020-11-25.txt)
-
cddid.tbl.gz(https://ftp.ncbi.nih.gov/pub/mmdb/cdd/)
Summary information about the CD(Conserved Domain) model.Show more information
"cddid.tbl.gz" contains summary information about the CD models in this distribution, which are part of the default "cdd" search database and are indexed in NCBI's Entrez database. This is a tab-delimited text file, with a single row per CD model and the following columns:
PSSM-Id (unique numerical identifier)
CD accession (starting with 'cd', 'pfam', 'smart', 'COG', 'PRK' or "CHL')
CD "short name"
CD description
PSSM-Length (number of columns, the size of the search model) -
Cog_LE.tar.gz(https://ftp.ncbi.nih.gov/pub/mmdb/cdd/little_endian/)
COG database, a part of CDD(Conserved Domain Database), for RPS-BLAST search.
Run query sequences RPS-BLAST against COG database [Default: E-value = 1e-2]. Best-hit (=lowest e-value) blast results are extracted and used in next functional classification step.
From best-hit results, extract relationship between query sequences and COG functional category as described below.
- Best-hit results -> CDD ID
- CDD ID -> COG ID (From
cddid.tbl) - COG ID -> COG Functional Category Letter (From
cog-20.def.tab) - COG Functional Category Letter -> COG Functional Category Definition (From
fun-20.tab)
⚠️ If functional category with multiple letters exists, first letter is treated as functional category (e.g. COG4862 has multiple lettersKTN. A letterKis treated as functional category).
Using the above information, the number of query sequences classified into each COG functional category is calculated and functional annotation and classification results are output.
COGclassifier -i [query protein fasta file] -o [output directory]
-i I, --infile I      Input query protein fasta file
-o O, --outdir O      Output directory
-d , --download_dir   Download COG & CDD resources directory (Default: '~/.cache/cogclassifier')
-t , --thread_num     RPS-BLAST num_thread parameter (Default: MaxThread - 1)
-e , --evalue         RPS-BLAST e-value parameter (Default: 1e-02)
-v, --version         Print version information
-h, --help            Show this help message and exit
Classify E.coli protein sequences into COG functional category (ecoli.faa):
COGclassifier -i ./example/input/ecoli.faa -o ./ecoli_cog_classifier
from cogclassifier import cogclassifier

query_fasta_file = "./example/input/ecoli.faa"
outdir = "./ecoli_cog_classifier"
cogclassifier.run(query_fasta_file, outdir)COGclassifier outputs 4 result text files, 3 html format chart files.
-
rpsblast_result.tsv(example)
RPS-BLAST against COG database result (format =outfmt 6). -
classifier_result.tsv(example)
Query sequences classified into COG functional category result.
This file contains all classified query sequences and associated COG information.Table of detailed tsv format information (9 columns)
Columns Contents Example Value QUERY_ID Query ID NP_414544.1 COG_ID COG ID of RPS-BLAST top hit result COG0083 CDD_ID CDD ID of RPS-BLAST top hit result 223161 EVALUE RPS-BLAST top hit evalue 2.5e-150 IDENTITY RPS-BLAST top hit identity 45.806 GENE_NAME Abbreviated gene name ThrB COG_NAME COG gene name Homoserine kinase COG_LETTER Letter of COG functional category E COG_DESCRIPTION Description of COG functional category Amino acid transport and metabolism -
classifier_count.tsv(example)
Count classified sequences per COG functional category result.Table of detailed tsv format information (4 columns)
Columns Contents Example Value LETTER Letter of COG functional category J COUNT Count of COG classified sequence 259 COLOR Symbol color of COG functional category #FCCCFC DESCRIPTION Description of COG functional category Translation, ribosomal structure and biogenesis -
classifier_stats.txt(example)
The percentages of the classified sequences are described as example below.86.35% (3575 / 4140) sequences classified into COG functional category.
-
classifier_count_barchart.html
Barchart of COG funcitional category classification result.
COGclassifier usesAltairvisualization library for plotting html format charts.
In web browser, Altair charts interactively display tooltips and can export image as PNG or SVG format.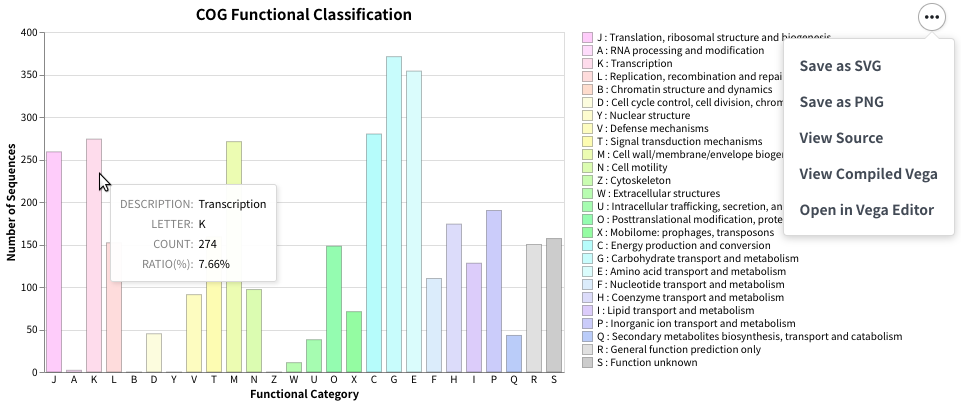
-
classifier_count_piechart.html
Piechart of COG funcitional category classification result.
Functional category with percentages less than 1% don't display letter on piechart.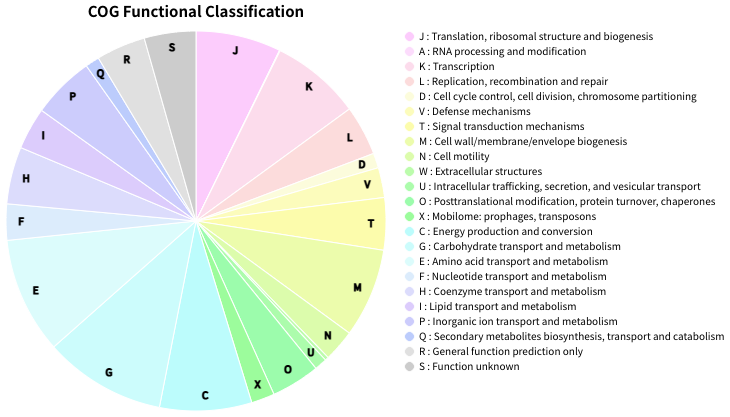
-
classifier_count_piechart_sort.html
Piechart with descending sort by count.
Functional category with percentages less than 1% don't display letter on piechart.
COGclassifier also provides barchart & piechart plotting scripts to customize charts appearence.
Each script can plot the following feature charts from classifier_count.tsv. See wiki for details.
-
Features of plot_cog_classifier_barchart script (wiki)
- Adjust figure width, height, barwidth
- Plot charts with percentage style instead of count number style
- Fix maximum value of Y-axis
- Descending sort by count number or not
- Plot charts from user-customized 'classifier_count.tsv'
-
Features of plot_cog_classifier_piechart script (wiki)
- Adjust figure width, height
- Descending sort by count number or not
- Show letter on piechart or not
- Plot charts from user-customized 'classifier_count.tsv'