![]()
pyMSAviz is a MSA(Multiple Sequence Alignment) visualization python package for sequence analysis implemented based on matplotlib. This package is developed for the purpose of easily and beautifully plotting MSA in Python. It also implements the functionality to add markers, text annotations, highlights to specific positions and ranges in MSA. pyMSAviz was developed inspired by Jalview and ggmsa. More detailed documentation is available here.
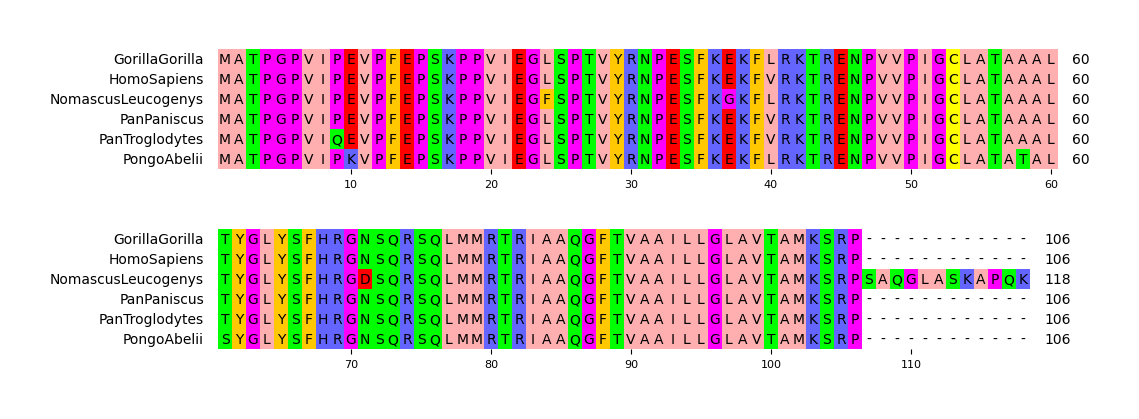
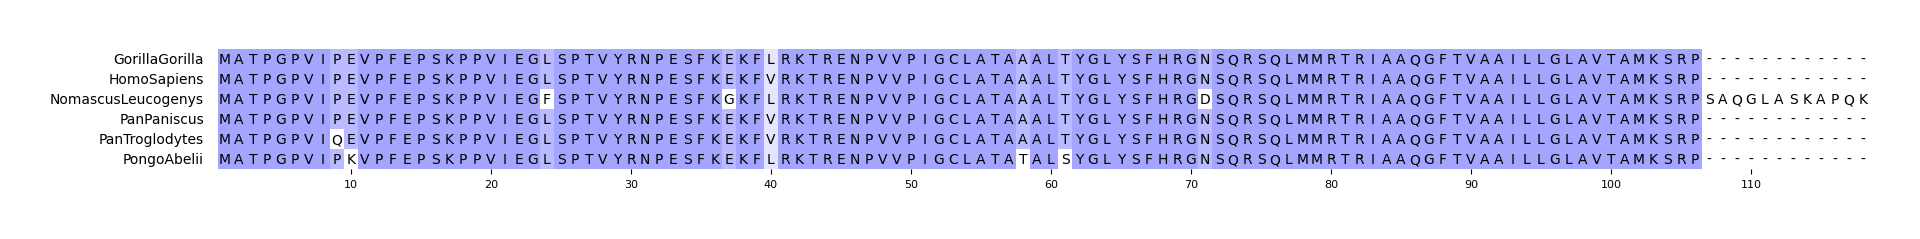
Fig.1 Simple visualization result
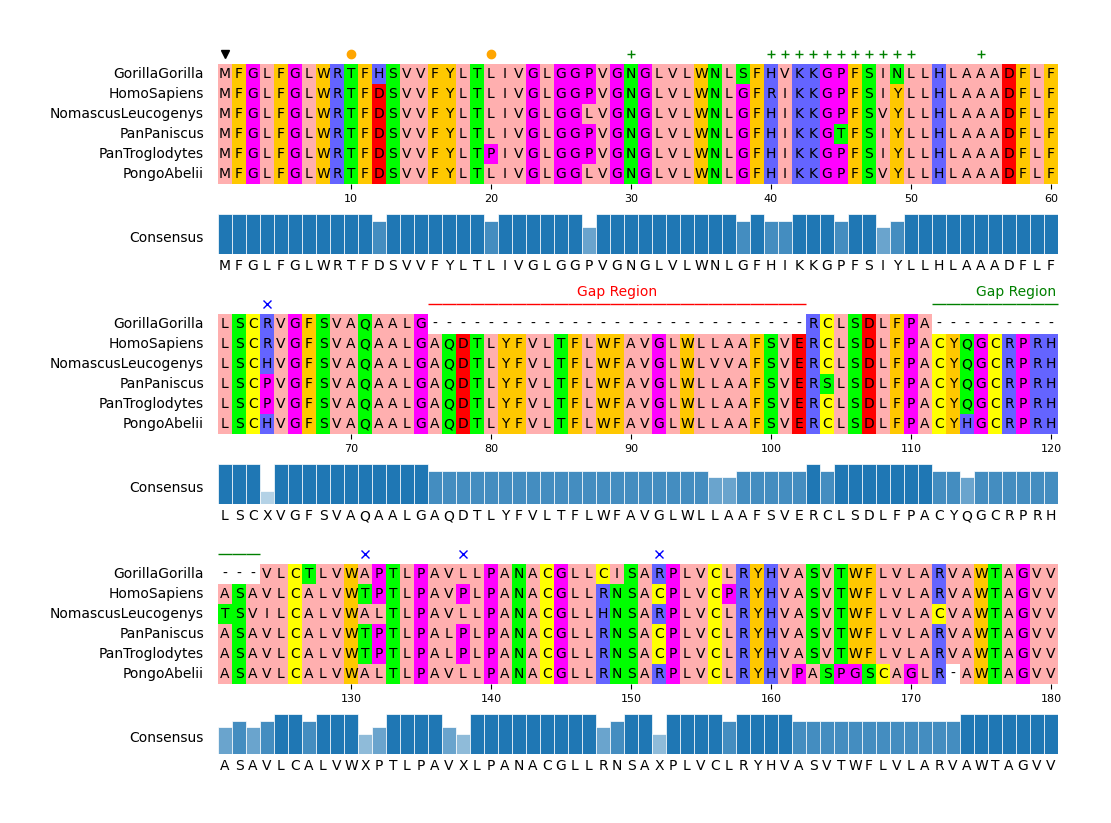
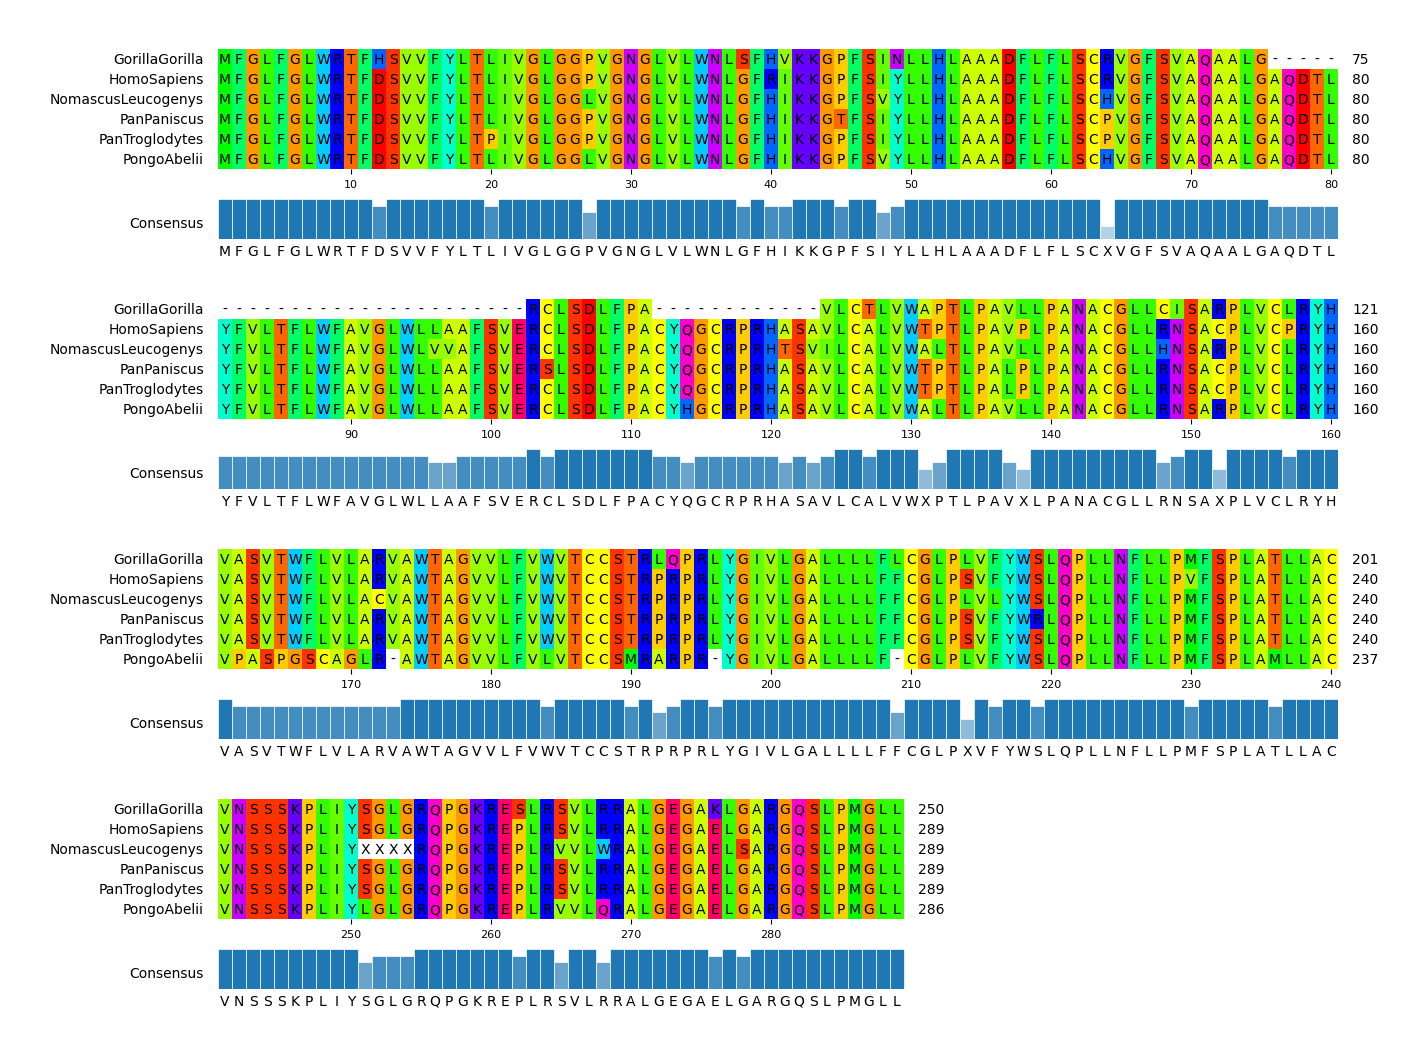
Fig.2 Customized visualization result
Python 3.8 or later is required for installation.
Install PyPI package:
pip install pymsaviz
Install bioconda package:
conda install -c conda-forge -c bioconda pymsaviz
Only simple example usage is described in this section. For more details, please see Getting Started and API Docs.
from pymsaviz import MsaViz, get_msa_testdata

msa_file = get_msa_testdata("HIGD2A.fa")
mv = MsaViz(msa_file, wrap_length=60, show_count=True)
mv.savefig("api_example01.png")
from pymsaviz import MsaViz, get_msa_testdata

msa_file = get_msa_testdata("MRGPRG.fa")
mv = MsaViz(msa_file, color_scheme="Taylor", wrap_length=80, show_grid=True, show_consensus=True)
mv.savefig("api_example02.png")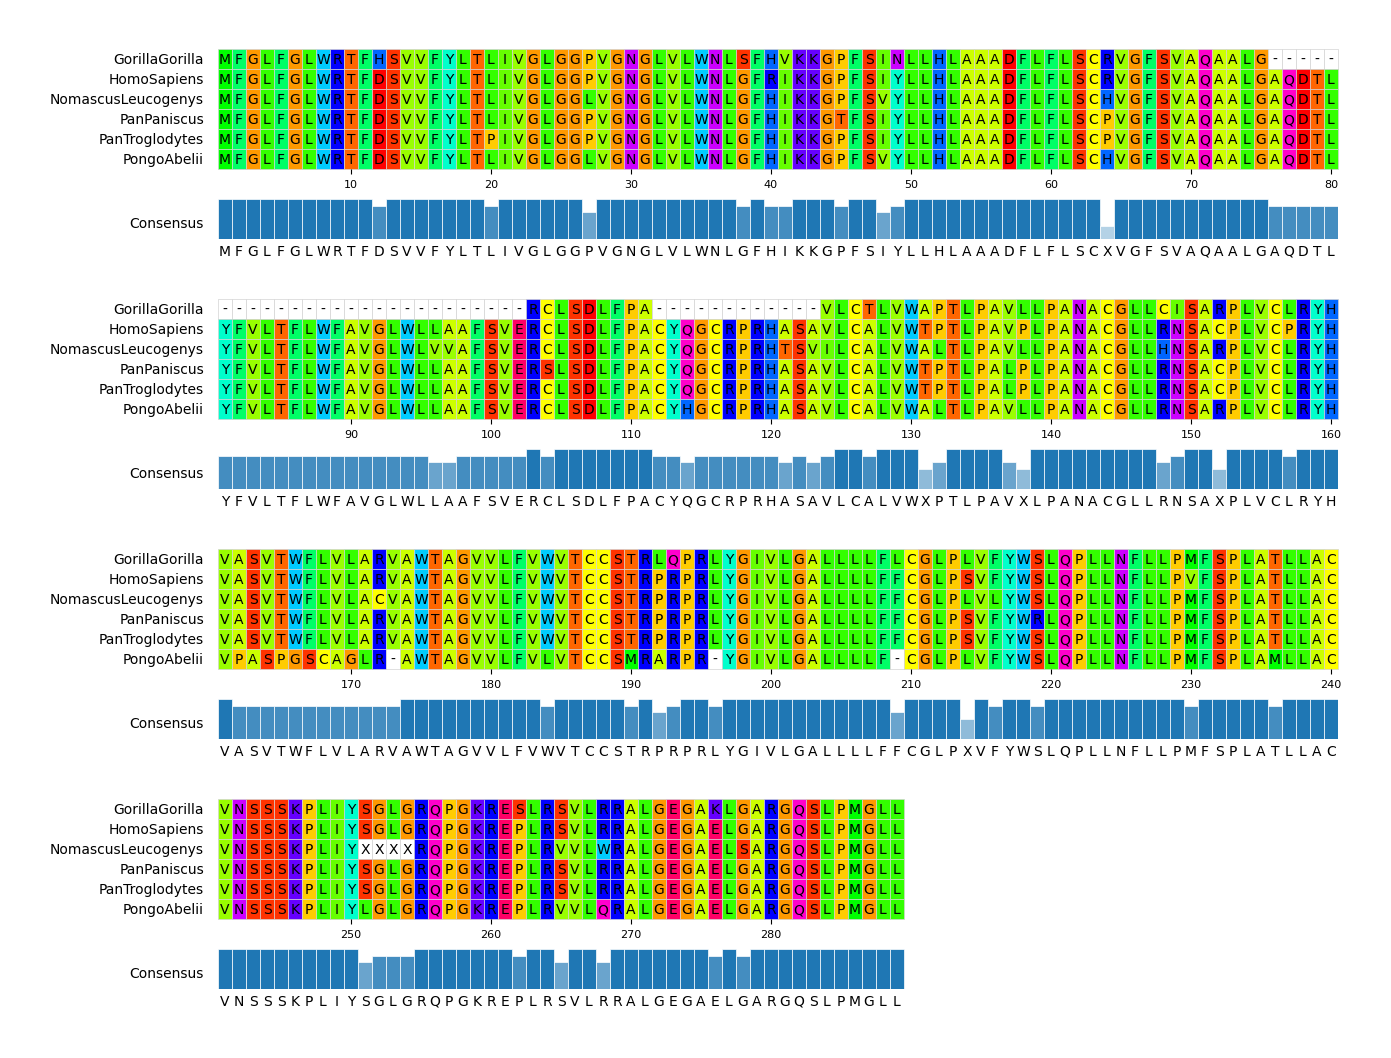
from pymsaviz import MsaViz, get_msa_testdata

msa_file = get_msa_testdata("MRGPRG.fa")
mv = MsaViz(msa_file, end=180, wrap_length=60, show_consensus=True)

# Extract MSA positions less than 50% consensus identity
pos_ident_less_than_50 = []
ident_list = mv._get_consensus_identity_list()
for pos, ident in enumerate(ident_list, 1):
    if ident <= 50:
        pos_ident_less_than_50.append(pos)

# Add markers
mv.add_markers([1])
mv.add_markers([10, 20], color="orange", marker="o")
mv.add_markers([30, (40, 50), 55], color="green", marker="+")
mv.add_markers(pos_ident_less_than_50, marker="x", color="blue")
# Add text annotations
mv.add_text_annotation((76, 102), "Gap Region", text_color="red", range_color="red")
mv.add_text_annotation((112, 123), "Gap Region", text_color="green", range_color="green")

mv.savefig("api_example03.png")
pyMSAviz provides simple MSA visualization CLI.
pymsaviz -i [MSA file] -o [MSA visualization file]
-i I, --infile I    Input MSA file
-o O, --outfile O   Output MSA visualization file (*.png|*.jpg|*.svg|*.pdf)
--format            MSA file format (Default: 'fasta')
--color_scheme      Color scheme (Default: 'Zappo')
--start             Start position of MSA visualization (Default: 1)
--end               End position of MSA visualization (Default: 'MSA Length')
--wrap_length       Wrap length (Default: None)
--wrap_space_size   Space size between wrap MSA plot area (Default: 3.0)
--label_type        Label type ('id'[default]|'description')
--show_grid         Show grid (Default: OFF)
--show_count        Show seq char count without gap on right side (Default: OFF)
--show_consensus    Show consensus sequence (Default: OFF)
--consensus_color   Consensus identity bar color (Default: '#1f77b4')
--consensus_size    Consensus identity bar height size (Default: 2.0)
--sort              Sort MSA order by NJ tree constructed from MSA distance matrix (Default: OFF)
--dpi               Figure DPI (Default: 300)
-v, --version       Print version information
-h, --help          Show this help message and exit

Available Color Schemes:
['Clustal', 'Zappo', 'Taylor', 'Flower', 'Blossom', 'Sunset', 'Ocean', 'Hydrophobicity', 'HelixPropensity',
 'StrandPropensity', 'TurnPropensity', 'BuriedIndex', 'Nucleotide', 'Purine/Pyrimidine', 'Identity', 'None']
Click here to download example MSA files.
pymsaviz -i ./example/HIGD2A.fa -o cli_example01.png --color_scheme Identity
pymsaviz -i ./example/MRGPRG.fa -o cli_example02.png --wrap_length 80 \
         --color_scheme Taylor --show_consensus --show_count
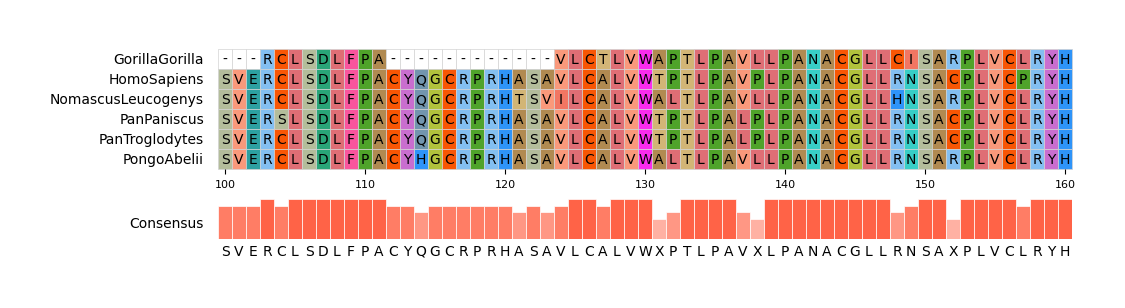
pymsaviz -i ./example/MRGPRG.fa -o cli_example03.png --start 100 --end 160 \
         --color_scheme Flower --show_grid --show_consensus --consensus_color tomato