Work in progress.
Distance cartogram from a set of source points and time matrix between them.
Time matrix is used to create a layer of image points.
Deformations to fit image points and source points are calculated using Waldo Tobler's bidimensional regression.
Directly adapted from Darcy software and ported to Python and JS.
mthh.github.io/distcartogram/js
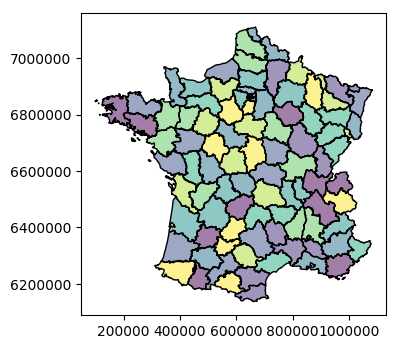
Load the background shape to be deformed:
import geopandas as gpd
import pandas as pd
background = gpd.read_file('data/depfr_simple.geojson')
background.plot()
Load the source points layer and a time matrix between these points:
source = gpd.read_file('data/source_pref.geojson')
mat = pd.read_csv('data/mat.csv')
Create the image points layer by approaching them or moving them away from a reference point:
image = getImageLayer(source, '94028', mat, 'INSEE_COM')
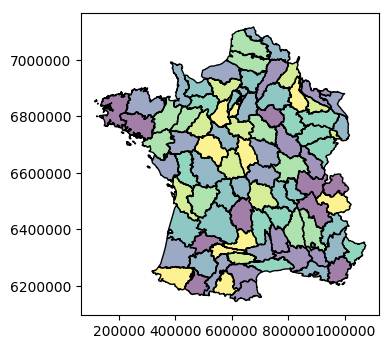
Compute the cartogram:
from distcartogram import DistCarto
c = DistCarto(source, 'INSEE_COM', image, 'id', background, 2)
result = c.transform_background()
result.plot()
Code is a direct adaptation of Darcy software (G. Vuidel and C. Cauvin - released under GPLv3 - Sourceforge).
Motivated by the wish to see if there is a possible interest or difficulty to integrate this method in another environment than Darcy, such as Magrit or a qgis plugin.