


- 💻 I’m currently enrolled in: AlaskaX's Synthetic Aperture Radar (SAR): Applications Professional Certificate
- 🐍 Book I am working through: Grokking Algorithms, 2nd edition
- 📘 Evening read: Love letter to the Earth by Thich Nhat Hanh
- ⏭ Best Video project ever: Let's Enhance by DUNK3D
- ✏️ Hobby: drawing, juggling, longboard
- 🃏 Fun fact: a recent fixation with card tricks and Rubik's cube
- 📝 Blog: mycarta
- 📫 How to reach me: matteo@mycarta.ca
- 🐦 On X (FKA Twitter) I was @my_carta
- GitHub and Stack Overflow Stats
- Skills
- Featured blog posts
- Articles published in Geophysical literature
- Upcoming articles and tutorials
- Projects portfolio
- Exploratory Data Analysis and visualization portfolio
- Coding challenges
- My Data Science continuous learning roadmap
- Book library
- Community engagement
- Stuff I would do differently

- Be a geoscience and data science detective
- From zero to JupyterLab pro on Windows 10
- Visual data exploration in Python – correlation, confidence, spuriousness
-
Introduction to Classification with SVMs. Article (with Jupyter notebooks) offering an intuitive understanding of SVMs using toy datasets inspired by classification problems in geophysics.
-
Mapping and validating lineaments. Article (with Jupyter notebook) demonstrating how to extract and enhance geologic lineaments from gravity data, and colocate them into a single map to increase confidence.
-
How to evaluate and compare color maps. Article (with Jupyter notebook) demonstrating how to evaluate default color maps and choose more perceptual alternatives. To date, it still ranks in the top 20 most downloaded papers (2010-2020) from The Leading Edge (Society of Exploration Geophysicists). It is based on research first published on my blog, Perceptual rainbow palette, part a and part b. The two parts are top results for the Google search perceptual rainbow and perceptual palette images, and are often used as reference in talks and other publications on colormaps (for example this Matplotlib talk at SciPy 2014).
For 52 Things You Should Know About Geocomputing: A crowdsourced collection of articles from practitioners, reviewed and edited by the Software Underground community:
- Some advice on reproducing scientific figures
- Keep on improving your Geocomputing projects
- Prototype colourmaps for fault interpretation
- Web app: Busting bad colormaps - a web-based
Panelapp to show the effects of using a bad colormap with Geophysical data. The first version was presented as a lightning talk at the Transform 2020 virtual conference organized by Software Underground; you can watch a video recording of the presentation here. Repo with code here.

- Tutorial: Working with 3D seismic data in Python using segyio, numpy, Scikit-image. A notebook to demonstrate how to:
- read a seismic amplitude volume and a seismic similarity volume as
numpyarrays usingsegyio - manipulate the similarity to create a discontinuity / fault volume
- create a fault mask and display a couple of amplitude time slices with superimposed faults
- write the fault volume to SEG-Y file re-using the headers from the input file
- read a seismic amplitude volume and a seismic similarity volume as

- Image augmentation pipelines for Deep Learning.
I've worked on two image augmentation pipelines to increase the size of training sets for classification of geologic edges in seismic data, a typically low bias / high variance problem.
- I developed the first pipeline to increase the size of training sets for classification of geologic edges in seismic data. The work was commissioned by a company (as a free-lance) and I am not able to share any detail on the image manipulations used. I have permission, however, to disclose that in production tests with Convolutional Neural Networks the approach helped improve performance, and that these efforts paved the path for the company's subsequent coding and investigations.
- I developed the second pipeline working with the images from the 2018 TGS Salt Identification Challenge on Kaggle in mind. Although I did not participate in the competition, having considere at length the problem of segmenting salt deposits, I came up with the idea of an "adversarial" augmentation strategy, in which not only the size of the training set is increased, but the task is rendered much harder with the image transformation. Some examples are shown below. Preliminar tests (unpublished) are encouraging and I am currently working at open-sourcing my functions by way of a PR to the Augmentor package, so that where operations can be added not only in a sequence, but also stochastically with a probability value assigned by the user for each operation.

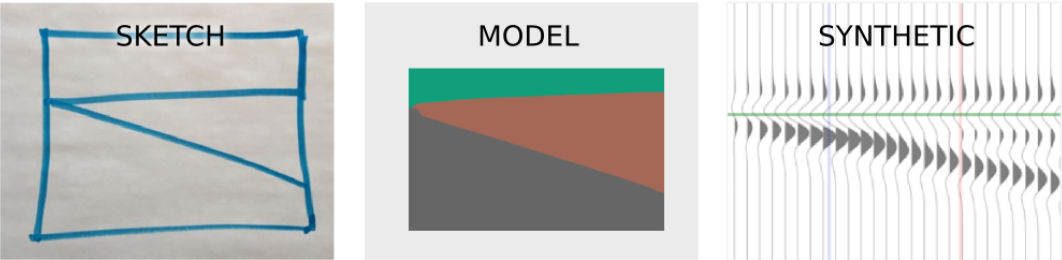
- Web app (Hackathon project): Sketch2model - a browser-based app to turn back-of-the-napkin geological sketches into geologic models that can then be used to generate synthetic seismic sections. The web app was Built around a prototype put together at the 2015 Calgary Geoscience Hackathon, organized by Agile Scientific, with team mates Evan Saltman and Elwyn Galloway, and special guest Ben Bougher from Agile. The original idea for the prototype was proposed by Elwyn at the Hackathon, was to make an app that would turn an image of geological sketch (for example one taken from a boardmeeting whiteboard) into a digital rock model. The implementation of the finished app involves using morphological filtering and other image processing methods to enhance the sketch and convert it into a model with discrete bodies to be passed to a tool akin to Agile's modelr.io to create and investigate a synthetic seismic model.
Blog posts:
sketch2model – sketch image enhancements
sketch2model – linking edges with mathematical morphology
Workflow:

- Web app (Hackathon project) : FRIDA (restore live app and add link here) - a browser-based app for interactive removal of acquisition footprint noise removal from 3D seismic data.
Prior to the hackathon I had done a lot of work imagining and protptyping a tool to remove acquisition footprint from 2D seismic slices (this has been my longest-lived side project) and eventually asked Elwyn to participate. If you are curious about the whole background, please read Chapter 39 of the upcoming 52 Things You Should Know About Geocomputing and then head over to my Tutorial notebook. For a definition of acquisition footprint, please read the SEG Wiki, and to see some published industry examples, read this blog post.
At the 2021 Hackathon, Transform virtual conference we took the existing tool to the next level with team mates @leocd91, @WesleyTheGeolien,and @markogauk. We spent significant efforts on brainstorming several approaches for how to turn the tool in a production caliber app; check this screen shot of our MIRO board:

And the we set out to work. We were really impressed with the final result, see animation below:

- Collaboration project: Rainbow. For this project with Matt Hall, I created a pipeline of image processing routines to enhance, clean-up, segment, and rectify the main map from published figures. This was a necessary preprocessing stage for Rainbow, an online tool for automagic recovery data from scientific images with unknown colourmaps. An example of the image processing work is shown is sketched below, with full list of operations in the intro to my blog series Computer vision in Geoscience, and detailed methodology described in Part I and Part II.

Also, watch Matt’s talk (very insightful and very entertaining) from the 2017 Calgary Geoconvention below:

- Knowledge sharing: My answer to the question In the northern hemisphere only, what percentage of the surface is land? on Stack Exchange Earth Science Beta. This was a lot of fun combining domain knowledge (about map projections) with a tiny bit of Python programming (using
numpyarrays) to provide a quantitative solution. It is the mini-project I am proud the most of, and I did it out of curiosity and the pure joy of solving a problem!
- Enhanced
seabornpairgrid matrix: one of the things I always do when I start looking at a multivariate probelm is to explore possible associations between features and target; one way I've found really useful is to "enhance" the standardSeabornpairgrid matrix by labeling each bivariate scatter plot with the distance correlation colored by p-value, and also rearrage the plots by the results of clustering analysis, like in the example below (you can read more about it here):

- At the 2020 FORCE Machine Predicted Lithology challenge, I used Ipywidget's interactive and the awesome
missingnolibrary to enable browsing exploration wells in the North Sea using a widget and check the chosen well's curves completeness, on the fly, as shown below (you can read more about it in here, and try the tool in this Jupyter notebook):

- 3D model of the ternary system quartz – nepheline – kalsilite, also called petrogeny’s “residua” system, which is used to describe the composition of many cooled residual magma. This was an advanced pet project while I was a student in Geology at the University of Rome, Italy. It involved using AutoCAD and 3D Studio Max to create a WRLM file. For the 3D sketchfab version of the model, I used a DXF export and re-rendered using Rhino3D. See the static snapshot below; navigate, inspet, and download the model on Sketchfab

- 3D model of the Yoder Tilley tetrahedron for basalt classification. In this visualization the tetrahedron isbroken to separate the Quartz Tholeiite, Oliving Tholeiite, and Alkali Basalt sub-volumes and show the critical planes of silica saturation and silica under-saturation. For the 3D sketchfab version of the model, I used a DXF export and re-rendered using Rhino3D. Check it out on Sketchfab

- 3D paths of colormap in CIELAB color space. These are a very useful way to analyze a colormap as they show clearly where abrupt chages in contrast happen; these are responsible for artifacts in mapping when these colormaps are used (more details in this blog post ). As example in the two animations below (produced using the 3D color inspector plugin for ImageJ), notice the may abrupt changes in the path for the classic Jet colormap (top) and compary to the regular piraling path of a more perceptual rainbow, called CubicYF (bottom), which I created:


- Completed all the Python challenges at Coding bat and earned an overall 10-Star badge.

📕
Click here to expand/collapse the roadmap section
- Project Management Skills for Leaders, Linkedin Learning
- Decision Intelligence, Linkedin Learning
- Test-Driven Development With PyTest, Real Python
- Enhance your Python unit testing using Coverage, Coursera Project Network
Foundations of Data Science Professional Certificate (edX)
- Computational Thinking with Python
- Inferential Thinking through Simulations
- Machine Learning and Predictions
- Pandas, Kaggle
- Intermediate Machine Learning, Kaggle
- Pandas short course (as a beta tester), DeepLearning.AI
- Intro to SQL, Kaggle
- Relational Databases Essential Training, LinkedIn Learning
- Spotfire Essentials I, Ruths.ai (now Petro.ai)
- Spotfire Essentials II, Ruths.ai (now Petro.ai)
- 15 Mistakes to Avoid in Data Science, LinkedIn Learning
- Climate Geospatial Analysis in Python with Xarray, Coursera Project Network
- ARSET - Fundamentals of Remote Sensing, NASA Applied Science
- ARSET - Introduction to Synthetic Aperture Radar, NASA Applied Science
- ARSET - Humanitarian Applications Using NASA Earth Observations, NASA Applied Science
- SAR-400: Synthetic Aperture Radar: Foundations, edX
- Echoes in space Introduction into the principles and applications of radar remote sensing, EO College
- AI for Everyone, Coursera
- Basics of AI Python Coding, DeepLearning.AI
- Machine learning explainability, Kaggle
- Intro to AI Ethics, Kaggle
- TensorFlow: Neural Networks and Working with Tables, LinkedIn Learning
- TensorFlow: Working with NLP, LinkedIn Learning
- TensorFlow 2.0: Working with Images, LinkedIn Learning
- Advanced AI: Transformers for Computer Vision, LinkedIn Learning
- Understanding Gender Equity - Race, Gender, and Workplace Equity certificate, edX
- Facing Racism and Emotional Tax in the Workplace - Race, Gender, and Workplace Equity certificate, edX
- Communication Skills for Dialoguing Across Difference - Race, Gender, and Workplace Equity certificate, edX
- Unconscious Bias: From Awareness to Action - Race, Gender, and Workplace Equity certificate, edX
- Understanding and Supporting LGBTQ+ Employees, LinkedIn Learning
- Understanding and Supporting Asian Employees, LinkedIn Learning
- Dealing with Microaggression as an Employee, LinkedIn Learning
- The Value of Employee Resource Groups, LinkedIn Learning
- Enhance Organizational Communications with Slack, Coursera Project Network
It looks like it has become very trendy these days to post a picture your datascience library. I admit it, I could not resist doing it too! Here is my collection of books, with a focus on Machine Learning and Data Exploration

-
Beta-testing courses by DeepLEarning.AI (2023).
-
Mentor, Canadian Society of Exploration Geophysicists (volunteer). From 2010 to 2020: mentored in Geophysics - and more recently in both Geophysics and Data Science - 3rd-4th year undergraduate students, and graduate students.
-
Co-founder and coordinator of the Calgary GeoPy group, which run semi-regular meetups for 2018 and 2019.
-
Editor, Canadian Society of Exploration Geophysicists (volunteer). From 2014 to 2016 Editor for the society's journal Recorder; notable project: conceived and coordinated a special topic edition on Programming in Geoscience.
- These days I would definitely build this one in Python: A study of Ricker wavelets in MS Excel (2016)