Data Science Capstone Project for General Assembly - Data Science Immersive 12-week full time 450 hour course.
Crude Oil extraction figures are published monthly, so for a given Basin Region there is a delay until the data is reported by the U.S. Energy Information Administration (EIA). However, Global Gas Flaring Estimates — Remotely Sensed VIIRS Nightfire Combustion data is delivered daily from The Earth Observation Group (EOG) after it is processed from raw multispectral satellite imagery. These Gas Flaring observations can act as a proxy for understanding the production of the facilities within a given Basin. Since production is a continuious variable, such a prediction would be a regression problem with continuious data predictions for Basin production, using the daily Global Gas Flaring data as aggregated to the Basin Regions.


This is the target data that this project aims to generate a prediction for. For each Basin Region there is Oil (bbl/d) Total production published monthly.
The US Energy Information Administration (EIA) releases a monthly Drilling Productivity Report. This report publishes data for seven regions as shown below in the EIA U.S. Basin Regions map.
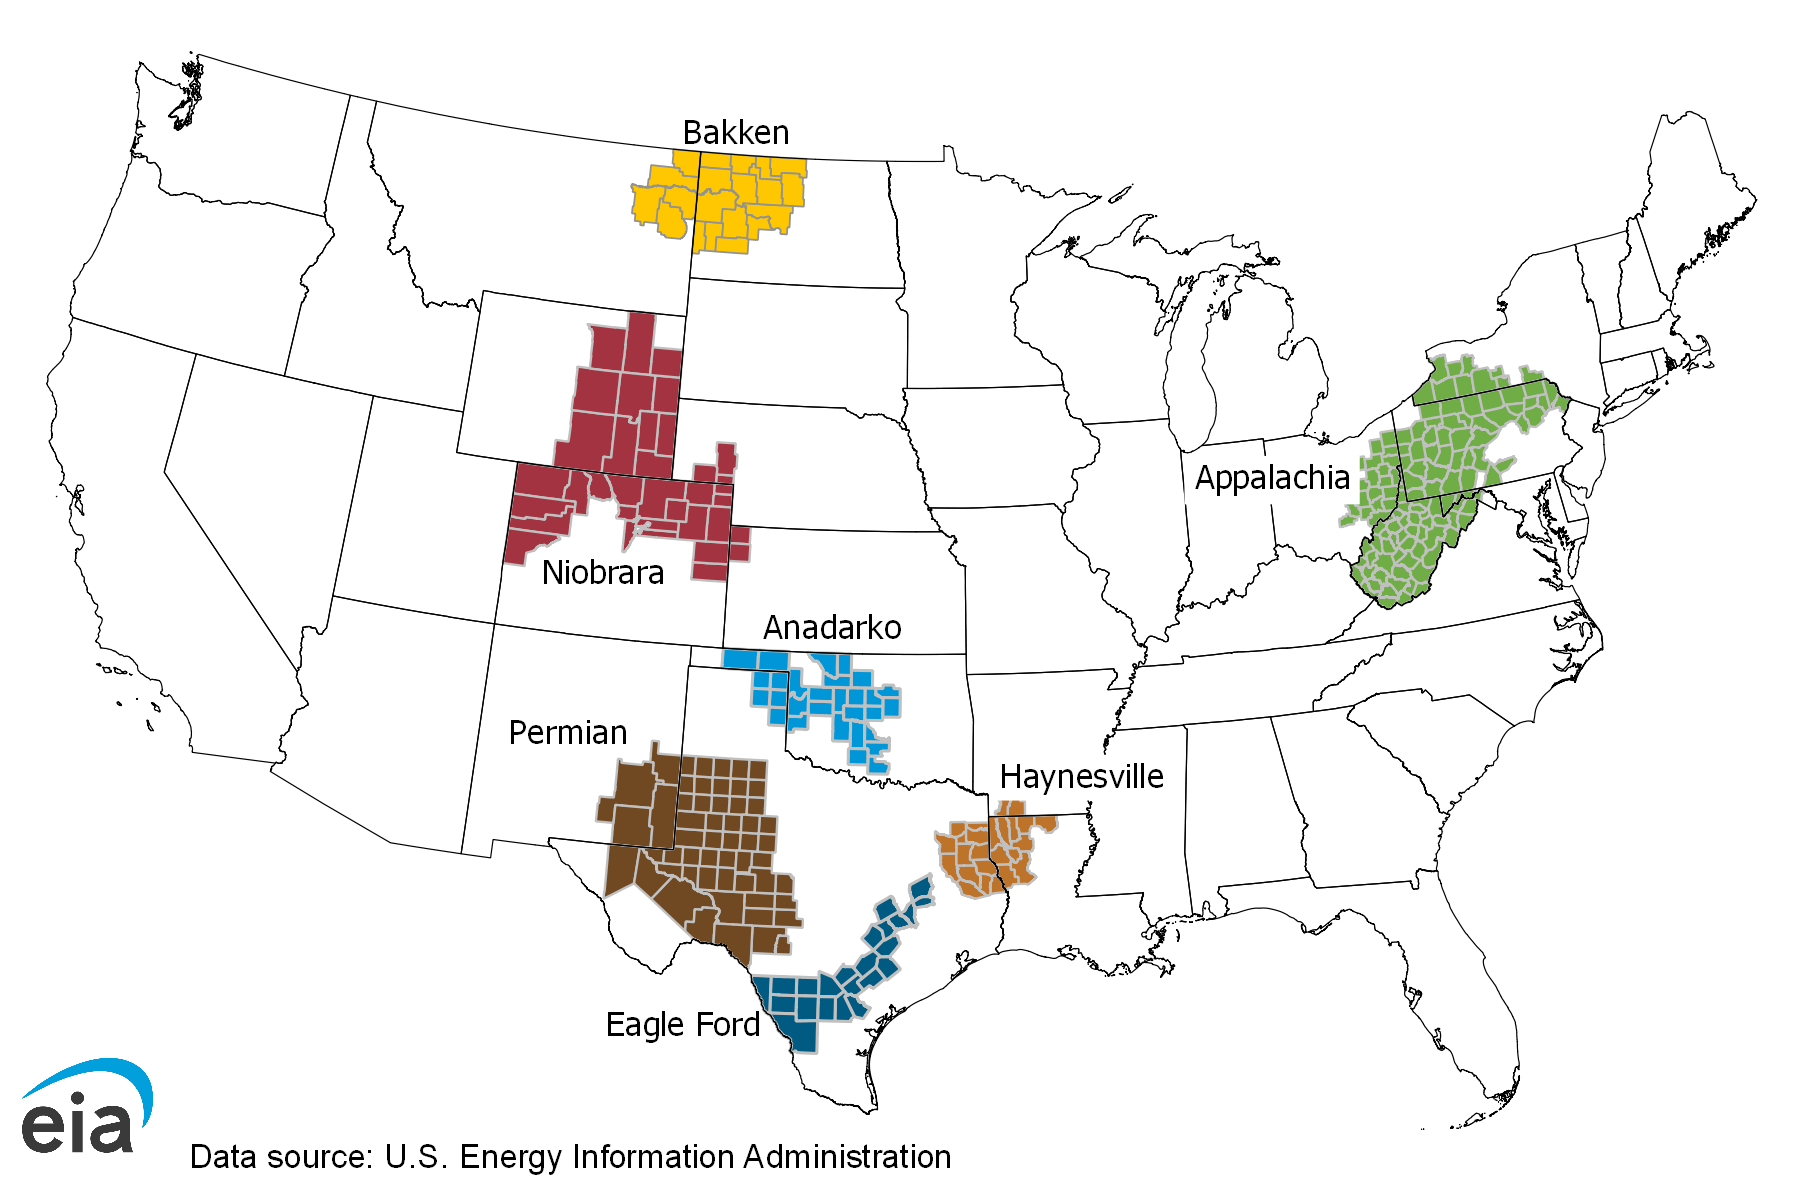
The Drilling Productivity Report uses recent data on the total number of drilling rigs in operation along with estimates of drilling productivity and estimated changes in production from existing oil and natural gas wells to provide estimated changes in oil and natural gas production for seven key regions. EIA's approach does not distinguish between oil-directed rigs and gas-directed rigs because once a well is completed it may produce both oil and gas; more than half of the wells produce both. Source: https://www.eia.gov/petroleum/drilling/
FAQ Link https://www.eia.gov/petroleum/drilling
This first section aims to provide the necessary background to understand how the Prediction Features are generated. In this case, Oil Production features are generated from daily measurements of the Nightfire dataset generated by The Earth Observation Group (EOG) from the Visible Infrared Imaging Radiometer Suite (VIIRS) as captured from the Suomi NPP Satellite.
While the extraction and combustion of fossil fuels continues to power a significant portion of our global energy needs, the demand and subsequent extraction of crude oil often emits Methane Gas as a byproduct, which is burned off as it is less hazardous to emit Carbon Dioxide than raw Methane Gas into the atmosphere. The process of burning off this methane gas is known as "Gas Flaring."

From NY Times Article - Despite Their Promises, Giant Energy Companies Burn Away Vast Amounts of Natural Gas - https://www.nytimes.com/2019/10/16/climate/natural-gas-flaring-exxon-bp.html
Oil extraction companies remove crude oil from the ground. The subsurface reservoirs of oil also contain large quantities of natural gas. When drilling to capture that crude oil as well as during the operation of the extraction facility, natural gas will escape into the atmosphere. The natural gas could be, and is, at some facilities, captured and transmitted to the market as a source of energy. However, storing and transmitting this resource requires expensive amounts of infrastructure. In areas where this pipeline and storage infrastructure isn't in place, the common practice is to burn the natural gas before it escapes into the atmosphere. While it may seem wasteful, it poses less of a an environmental hazard to burn this valuable energy resource off than to let it escape into the atmosphere. Releasing this gas as methane rather than burning more harmfully contributes to global warming. However, this burning or "Gas Flaring" of the natural gas still emits damaging levels of carbon dioxide. Flaring is less harmful than the "do nothing" approach.
While it is possible to monitor Gas Flaring at a facility, to do so at a global scale would be cost prohibitive. There is also a likelihood that energy companies may not be as forthcoming or as transparent in self-monitoring, as the New York Times reported in the 2019/10/16 article entitled Despite Their Promises, Giant Energy Companies Burn Away Vast Amounts of Natural Gas. Additionally, because of geopolitics, monitoring in some countries such as Iran or Venezuela would be difficult. However, satellite-mounted remote sensing technology and open data provides an alternative solution. It is possible to get a global read on Gas Flaring using remote sensing. More on Gas Flaring from The Earth Observation Group;
Gas flaring is a widely used practice for the disposal of natural gas in petroleum producing areas where there is no infrastructure to make use of the gas. Gas flaring is widely recognized as a waste of energy and an added load of carbon emissions to the atmosphere. Despite this recognition, there is substantial uncertainty regarding the magnitude of gas flaring. Current estimates of gas flaring volumes rely on voluntary reporting made by corporations and individual countries. There is very little independent data on gas flaring volumes and it is known that some of the reported volumes are low. Source: https://eogdata.mines.edu/dmsp/gas_flares.html
The US National Oceanic and Atmospheric Administration (NOAA) recently "ceased production" of Earth Observation Group (EOG) data products. The EOG was within the National Centers for Environmental Information (NCEI) until October 15, 2019. Fortunately, the Colorado School of Mines' Payne Institute for Public Policy has become the new home for the EOG and its data.
The Earth Observation Group (EOG) specializes in nighttime observations of lights and combustion sources worldwide. The group started working with Defense Meteorological Satellite Program (DMSP) data in 1994 and has produced a time series of annual cloud-free composites of nighttime lights. EOG's current focus is on deriving products from nighttime Visible Infrared Imaging Radiometer Suite (VIIRS) data. Source: https://payneinstitute.mines.edu/eog/
Having a home for the EOG and its work and subsequent data is critical for the continued monitoring of the global phenomenon known as Gas Flaring. As EOG hosts the Nightfire V3.0, V2.1 (GRAVITE) and V2.1 (CLASS) dataset, a collection of geolocated points across the earth that represent remotely sensed combustion sources that are released and updated daily. Which, for open data, from an agency recently housed within the federal government, is extremely fast image processing turnaround. Additionally, the data is easily accessible and leveraged as it is served up as .csv daily files.

- Nightfire data make use of six spectral bands to detect and characterizes subpixel infrared emitters. Provides locations and times of hot pixel detections along with estimates of temperatures and source sizes. For cloud-free gas flares a calculation is performed to estimate the flared gas volume in methane equivalents. Nighttime data are available on 24 hour increments. Monthly and annual cloud-free composites are in preparation.
- Day/night band - low light imaging data: Detections of lighting from cities, towns, villages, combustion sources and lit fishing boats. EOG provides: A) Geolocated subsets for specific areas of interest. B) Global nightly mosaics. C) Monthly cloud-free composites. D) Annual cloud-free composites.
- Geotiff images of a wide range of VIIRS images and environmental data records. This service was established to serve the broader user community who are unable to download the high data volume HDF5 format files and prefer to have the data in geolocated form. Source: https://www.ngdc.noaa.gov/eog/viirs/index.html
As explained in the published and quoted definition above, Nightfire V3.0 data is a byproduct of processing another source of data. That data is the Visible Infrared Imaging Radiometer Suite (VIIRS) which is data derived from the Suomi NPP Satellite system. Suomi NPP is a multispectral Earth-observing satellite system. For the geo-monitoring uninitiated -quite simply - this satellite takes a bunch of pictures from space, specializing in observing and capturing data from different bands of the electromagnetic spectrum, some which are in the spectrum that is visible to the human eye and some of the spectrum that is not.
Nightfire V3.0 (GRAVITE) Raw Data File Example - 2019/12/20: https://eogdata.mines.edu/wwwdata/viirs_products/vnf/v30//VNF_npp_d20191220_noaa_v30-ez.csv.gz


About VIIRS Nightfire:
VIIRS is unique in the recording of near-infrared and short-wave infrared data at night. This includes the M7, M8, and M10 spectral bands. Nighttime M11 data became available in December 2017. With sunlight eliminated, combustion sources are readily detected, particularly in the M10 and M11 bands. The recorded signal can be fully attributed to the combustion source. In our analysis we use data from all of the VIIRS bands collecting data at night. The data from M10, M11, M12 and M13 bands are used to detect combustion sources. To eliminate noise, confirmation is sought in the Day/Night Band (DNB), M7 and M8. Plank curve fitting is performed to estimate the temperature of background and hot sources. Results are distributed in the form of CSV (full and/or "ez") and KMZ files. The KMZ and "ez" CSV files have data from the local maxima detected in the M10 and M11 bands. Filtering is used to eliminate the bow tie effects from the identification of local maxima. The full CSV has data from all of the pixels with radiances above background noise in the M10 and M11 bands. Readme files are provided. Note that the processing algorithms evolve over time, so there may be multiple versions spanning the VIIRS record 4/2012-present. Periodic reprocessing is done to update Nightfire products to the most recent version. Source: https://eogdata.mines.edu/download_viirs_fire.html
To summarize, the Suomi NPP Satellite captures images from a polar orbit, and captures that imagery via the hardware on the satellite known as the Visible Infrared Imaging Radiometer Suite (VIIRS), which is then processed via the Earth Observation Group (EOG) team into the Nightfire V3.0, V2.1 (GRAVITE) and V2.1 (CLASS) datasets which tracks combustion locations across Earth.
VIIRS data can provide site-specific tracking of natural gas flaring for use in evaluating efforts to reduce and eliminate routine flaring. Source: Methods for Global Survey of Natural Gas Flaring from Visible Infrared Imaging Radiometer Suite Data -MDPI - https://www.mdpi.com/1996-1073/9/1/14
So by using Nightfire V3.0, V2.1 (GRAVITE) and V2.1 (CLASS) we can monitor specific locations (or areas) where suspected oil extraction is occurring and use it as a measure for daily Gas Flaring combustion.


