Investigate how to track success metrics #10701
Comments
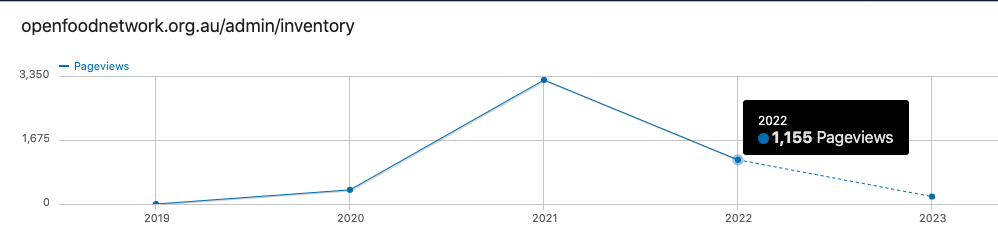
I thought I'd start with this because it's easier to understand ;) In Matomo, I can graph usage of a particular page, but can only do it for one instance at a time, so I looked at AU. Page hits for 2022:
Clearly, the products page is used more. A graph for more context:
So we could measure the unique pageviews as a percentage of all admin pageviews, or compared with product pageviews. Eg To replicate:
|

|
@dacook you can see several instances at the same time using the "roll-up" views in matomo. |
From # Number of variants
Spree::Variant.count
=> 50829
# Number of variants that have one or more variant overrides
Spree::Variant.select('spree_variants.id').distinct.joins(:variant_overrides).count
=> 3748
# Number of variants that have overrides, and orders
Spree::Variant.select('spree_variants.id').distinct.joins(:variant_overrides).joins(:line_items).count
=> 2976
# Number of variants that have overrides, and recent orders (last 6 months)
Spree::Variant.select('spree_variants.id').distinct.joins(:variant_overrides).joins(:line_items).where('spree_line_items.updated_at >= ?', 6.months.ago ).count
=> 851
# Number of variants that have overrides, recent orders and neither stock nor price overrides. I shall call these "unnecessary overrides".
Spree::Variant.select('spree_variants.id').distinct.joins(:variant_overrides).joins(:line_items).where('spree_line_items.updated_at >= ?', 6.months.ago ).where('variant_overrides.count_on_hand is null AND variant_overrides.price is null').count
=> 151
# Percentage of recently used overrides that were unnecessary:
include ActionView::Helpers::NumberHelper
number_to_percentage 151.to_f / 851 * 100
=> "17.744%" |
|
I tried scripting this up to run on multiple servers, but gave up. Here's a few manually collected ones:
Wow, look at FR.. |
|
@mariocarabotta , when you're able, can you please confirm the above metrics are what you intended? |
|
Hi @kirstenalarsen , are you able to comment if these metrics are sufficient to capture what Mario's defined at the top? And how many/which instances should we count? I'll summarise my findings:
I gathered these two numbers and used them to create a percentage:
Percentage of recently used overrides that were unnecessary: eg AU
For AU in 2022, UNIQUE PAGEVIEWS:
|
|
Hmm. I think that this is probably what we need to run with, but I think we also need to keep an eye on the recently used overrides as a total. I am (for example) a user who DOES override stock and price in inventory, but I am still only using it for ease of use - I just don't bother managing stock and price in the underlying product table, I just do it in inventory. So the override of stock / price DOES NOT mean that I need to use inventory, it's just a lot easie to manage the subset of products I'm working with. So i think we need both the %, but be careful about assuming that these are the only ones that are 'unnecessary;. Once we have product tags, we would expect / hope to see the total number of overrides falling as well I think |
|
Thanks @kirstenalarsen , I'll set up a document for filling in these measurements, ensuring there's space for both the percentage and the overall totals. I'm thinking a google sheet. Do you agree about checking the above-listed three instances (and only them)? |
|
Hmm I'm finding my way around matomo a bit more now, and found a better graph (permalink):
I don't think we need to record before/after for this because we can query the data anytime. |

|
For code review, I'll just request that someone review my queries above, that they look right. |
|
Yes fine to just get those 3 servers |
|
The queries above look fine but we can't tell if an override is necessary or not.
All that said, I'm not quite sure what we're trying to find out. Will this actually change our direction or do we just want to proof that we are doing the right thing? |
|
Thanks Maikel
A good question. I don't know but guess we're just looking for validation. Fine-tuning the metrics might provide a better measure, but this broad measurement hopefully will at least give us an indication of success. @kirstenalarsen or @mariocarabotta , are you ok with the caveats Maikel points out, or do you think we need to go further? |
|
ping @kirstenalarsen or @mariocarabotta , are you ok with the caveats Maikel points out above, or do you think we need to go further? |
|
It's good enough :) |
|
The Google sheet is prepared here and can be edited by anyone with the link: https://docs.google.com/spreadsheets/d/1Ld3CKLBEBhjzg5fZ8736cN75kMs-xHSqL9dyn2fpe9A/edit#gid=0 |
Figure out what's the most appropriate approach to monitor metrics pre and post release
need to understand if DB queries will be sufficient, or if we need analytics for inventory. If the latter, check if inventory is already being tracked or if we need to start tracking now to have some historical data.
What should a dev review?
For code review, I'll just request that someone review my queries below.
The text was updated successfully, but these errors were encountered: