


DVB-T dongles based on the Realtek RTL2832U can be used as a cheap SDR (Software-defined radio), since the chip allows transferring the raw I/Q (In-phase / Quadrature) samples to the host, which is officially used for DAB/DAB+/FM demodulation.
(More about history & discovery of rtl-sdr)
There is various software for DSP (Digital signal processing), spectral analysis and signal intelligence using RTL-SDR such as SDR#, gqrx and gnuradio. Apart from these, there is librtlsdr which most of the user-level packages rely because of the reason that librtlsdr comes as a part of the rtl-sdr codebase. This codebase contains both the library itself and also a number of command line tools such as rtl_test, rtl_sdr, rtl_tcp, and rtl_fm for testing RTL2832 and performing basic data transfer functions. Therefore, librtlsdr is one of the major tools in RTL-SDR community.
Most of the technically questions RTL-SDR enthusiasts ask is about reading samples from device and processing raw I/Q samples. I wanted to answer that kind of questions and demonstrate a implementation of this with rtl_map project which is built on top of librtlsdr. Also, I went a step further and added graph feature that creates amplitude (dB) - frequency (MHz) graph using gnuplot and FFT (Fast Fourier transform) algorithm. (fftw used for this approach) I can list other useful open-source projects as #1, #2 and #3.
Another purpose of this project is making a testing tool & frequency scanner application for security researches.
https://www.rtl-sdr.com/rtl_map-a-simple-fft-visualizer-for-rtl-sdr/
- libusb1.0 (development packages must be installed manually, see libusb.info)
- gnuplot (must be installed manually, see installation page)
- librtlsdr (cmake / automatic installation & linking)
- fftw3 (cmake / automatic installation & linking)
git clone https://github.com/orhun/rtl_map
cd rtl_map
mkdir build
cd build
cmake ../
make
sudo make install
sudo ldconfig
gcc rtl_map.c -o rtl_map -lrtlsdr -lfftw3 -lm
-d, set device index (default: 0)
-s, set sample rate (default: 2048000 Hz)
-f, center frequency (Hz) [mandatory argument]
-g gain (0 for auto) (default: ~1-3)
-n number of reads (default: int_max.)
-r, refresh rate for continuous read (default: 500ms)
-D, don't show gnuplot graph (default: show)
-C, continuously read samples (default: off)
-M, show magnitude graph (default graph: dB)
-O, disable offset tuning (default: on)
-T, turn off terminal log colors (default: on)
-h, show help message and exit
filename (a '-' dumps samples to stdout)
[k3@arch ~]$ rtl_map -f 88000000 -D capture.dat
[01:00:26] INFO Starting rtl_map ~
[01:00:26] INFO Found 1 device(s):
[01:00:26] INFO #0: Generic RTL2832U OEM
Found Rafael Micro R820T tuner
[01:00:27] INFO Using device: #0
[01:00:27] INFO Gain set to 14.
Supported gain values (29): 0.0 0.9 1.4 2.7 3.7 7.7 8.7 12.5 14.4 15.7 16.6 19.7 20.7 22.9 25.4
128.0 29.7 32.8 33.8 36.4 37.2 38.6 40.2 42.1 43.4 43.9 44.5 48.0 49.6
[01:00:27] INFO Center frequency set to 88000000 Hz.
[01:00:27] INFO Sampling at 2048000 S/s
[01:00:27] INFO Reading samples...
[01:00:27] INFO Done, exiting...
rtl_map -f 88000000 -D -
rtl_map -f 88000000 -D -C -n 10 -
[k3@arch ~]$ rtl_map -f 88000000
[01:00:28] INFO Starting rtl_map ~
[01:00:28] INFO Found 1 device(s):
[01:00:28] INFO #0: Generic RTL2832U OEM
Found Rafael Micro R820T tuner
[01:00:28] INFO Using device: #0
[01:00:28] INFO Gain set to 14.
Supported gain values (29): 0.0 0.9 1.4 2.7 3.7 7.7 8.7 12.5 14.4 15.7 16.6 19.7 20.7 22.9 25.4
28.0 29.7 32.8 33.8 36.4 37.2 38.6 40.2 42.1 43.4 43.9 44.5 48.0 49.6
[01:00:29] INFO Center frequency set to 88000000 Hz.
[01:00:29] INFO Sampling at 2048000 S/s
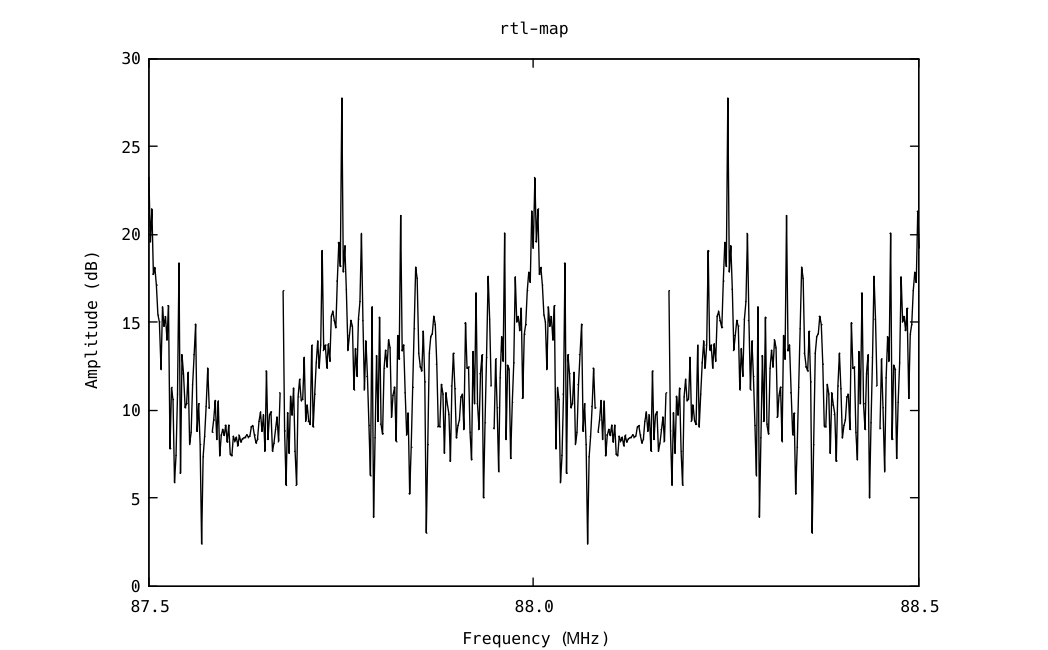
[01:00:29] INFO Creating FFT graph from samples using gnuplot...
[01:00:29] INFO Done, exiting...
rtl_map -f 88000000 -C -r 100

There is a common issue with cheap RTL-SDR receivers which is center frequency spike or central peak problem related to I/Q imbalance. This problem can be solved with a implementation of some algorithms. (For more details: #1, #2)
- Implement I/Q correction
- Find the maximum value of samples, show it on graph with a different color. Might be useful for frequency scanner.
- Frequency scanner feature
- Check correctness of min/max point calculation.
- Check correctness of amplitude (dB) calculation.
- 820T2 tuner used for testing. Other RTL-SDR devices must be tested.
You can contribute to this project if you are a RTL-SDR enthusiast or researcher. Fork the repository and start coding. I hope some people on this planet will consider my TODO(s) and help me build the frequency scanner tool :)
GNU General Public License (v3)
Copyright (c) 2019-2023, orhun