Add option to send underlying metric timestamps on prometheus output #11
Conversation
This file contains bidirectional Unicode text that may be interpreted or compiled differently than what appears below. To review, open the file in an editor that reveals hidden Unicode characters.
Learn more about bidirectional Unicode characters
odeke-em
approved these changes
Oct 2, 2020
There was a problem hiding this comment.
LGTM, thank you @jasonk000! I shall publish a new change shortly after this merge so that the go.mod entry in your import can be updated.
|
I've cut the release v0.0.6 https://github.com/orijtech/prometheus-go-metrics-exporter/releases/tag/v0.0.6, thank you and enjoy! |
|
So quickly - thank you! |
tigrannajaryan
pushed a commit
to open-telemetry/opentelemetry-collector
that referenced
this pull request
Oct 21, 2020
Adds a `send_timestamps` option to the prometheus exporter to allow it to send scrape timestamps. By default, when scraping, Prometheus records data assuming that the presented sample is at the instant of the scrape. For data sources that cache the underlying information and do not refresh on scrape, this can lead to metric samples being recorded at the wrong timestamp. For ex, cadvisor caches for many seconds (4-20 in our experience), and so a sample taken "now" may actually be a sample from 20s ago. To handle this situation, the exposition format allows an exporter to advise the Prometheus server of the timestamp of the underlying scrape. OpenTelemetry is aware of the timestamp of the scrape. This change adds an option to have OpenTelemetry send the timestamps of underlying samples out with the Prometheus exporter. Visually, the image shows existing behavior prior to 9.45am and with `send_timestamps: true` set from 9.45am onwards. This is metrics for a job using a single CPU. 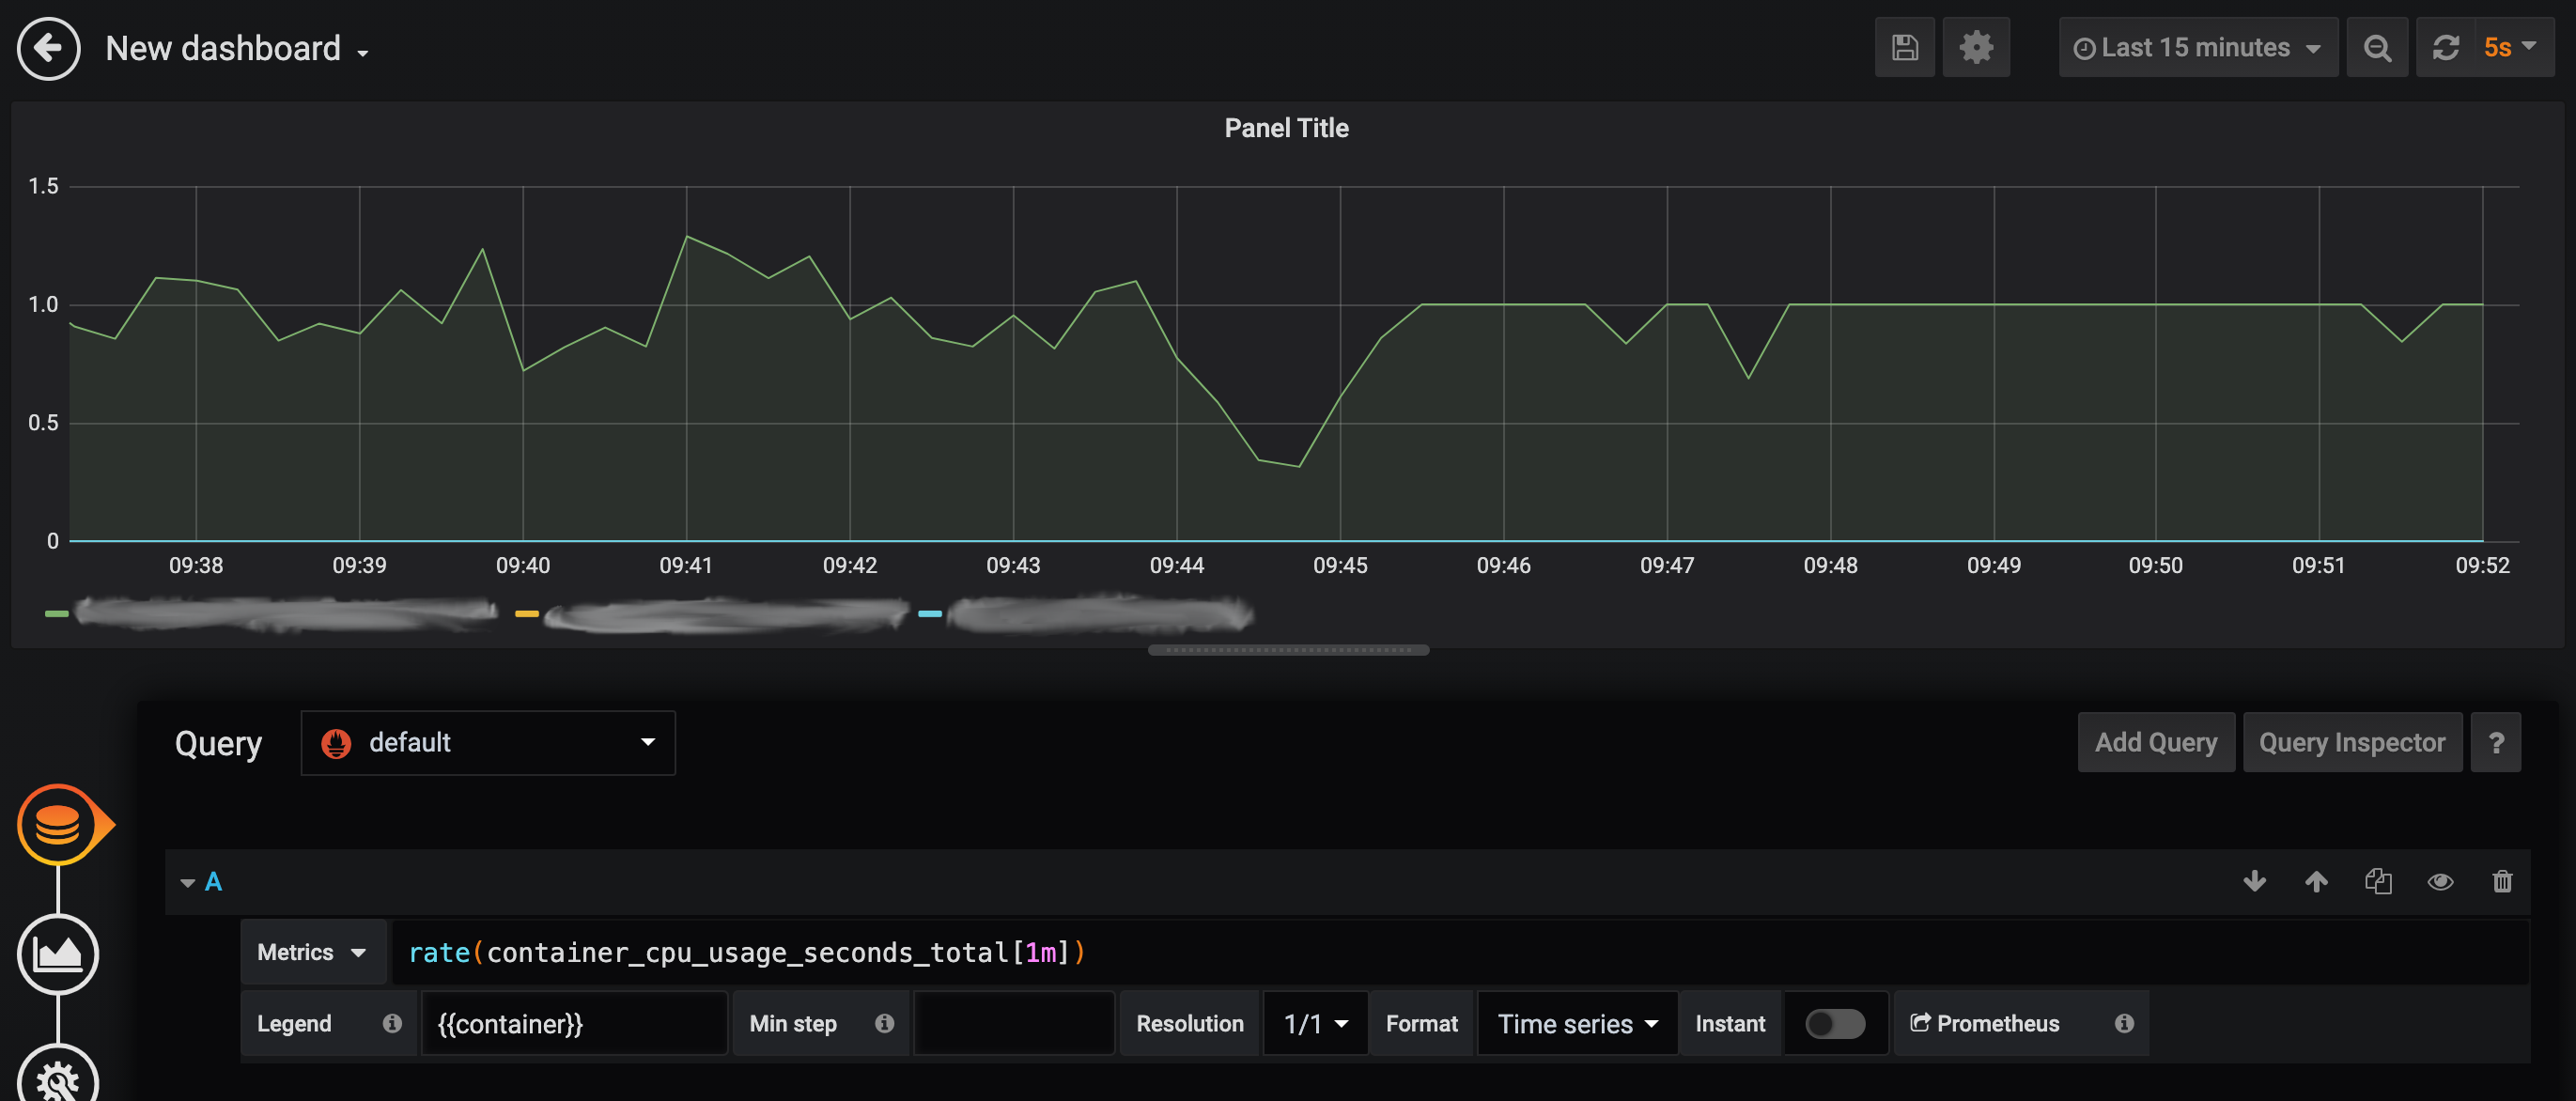 **Related issues:** google/cadvisor#2526 orijtech/prometheus-go-metrics-exporter#11 **Testing:** Test cases have been added. In addition, for e2e test, see screenshot from our environment above. **Documentation:** The `prometheusexporter` README has been updated.
Sign up for free
to join this conversation on GitHub.
Already have an account?
Sign in to comment
Add this suggestion to a batch that can be applied as a single commit.
This suggestion is invalid because no changes were made to the code.
Suggestions cannot be applied while the pull request is closed.
Suggestions cannot be applied while viewing a subset of changes.
Only one suggestion per line can be applied in a batch.
Add this suggestion to a batch that can be applied as a single commit.
Applying suggestions on deleted lines is not supported.
You must change the existing code in this line in order to create a valid suggestion.
Outdated suggestions cannot be applied.
This suggestion has been applied or marked resolved.
Suggestions cannot be applied from pending reviews.
Suggestions cannot be applied on multi-line comments.
Suggestions cannot be applied while the pull request is queued to merge.
Suggestion cannot be applied right now. Please check back later.
By setting:
This will ensure that timestamps are sent out along with the metrics. This is important when the metric is not generated synchronously (which is the case for the opentelemetry prom exporter), to ensure that prometheus ingested metrics are ingested "as of" the correct originating sample/scrape time.