inKub8 is an open source tool for visualizing the architecture of your cluster and monitoring it’s health. It integrates with Prometheus and Grafana allowing you to scrape detailed metrics from your cluster and transform those metrics into beautiful and easy to understand charts and graphs.
Installing inKub8 provides you access to three pages that each provide their own data and functionality that give you extensive access to your Kubernetes cluster.
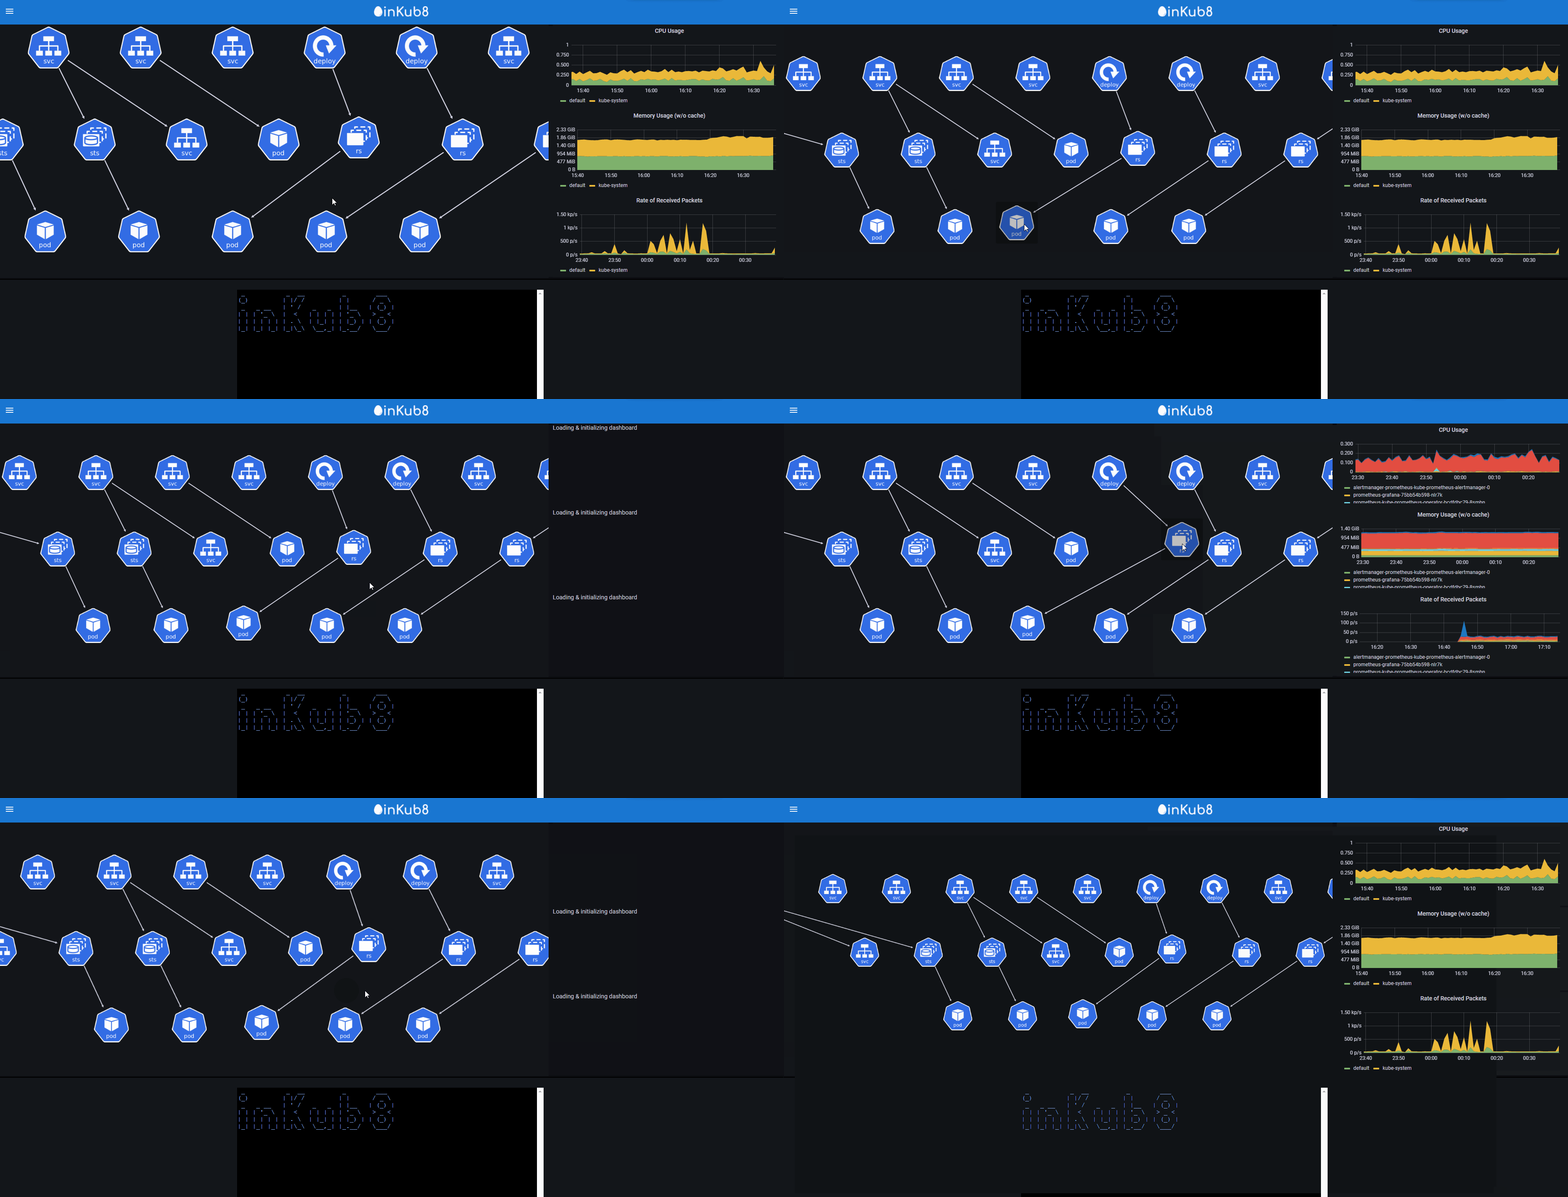
The landing page provides you with a visual representation of your Kubernetes cluster with the different cluster objects and their relationships illustrated using the Cytoscape.js library. When an object is clicked, i’s corresponding metrics are loaded on the right side for fast, efficient monitoring. The cluster objects can be customized according to the user’s preferences, maximizing the user’s ability to monitor the cluster and respond to cluster health threats.
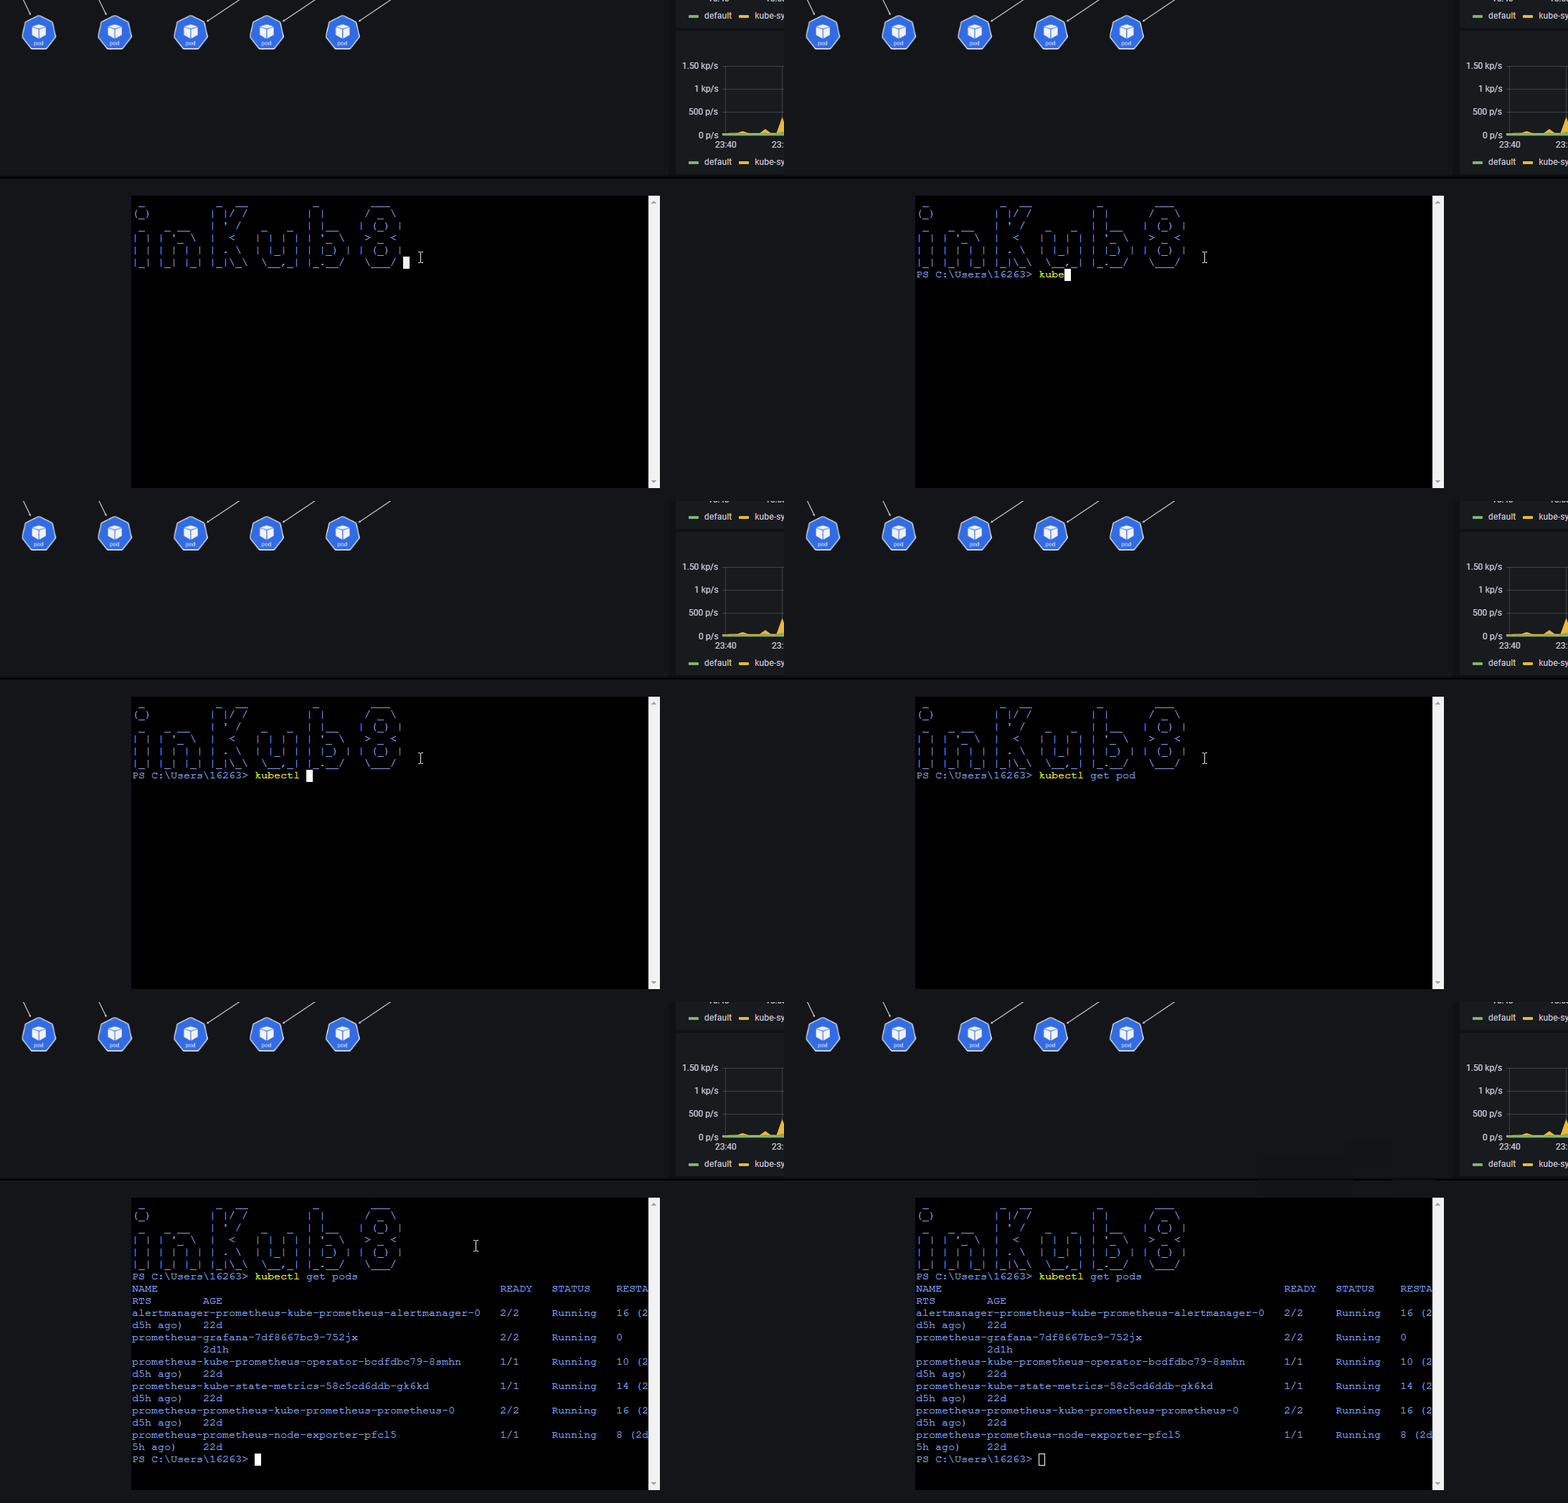
The home page includes an integrated CLI for managing your cluster and more, making it easier to stay organized and efficient.
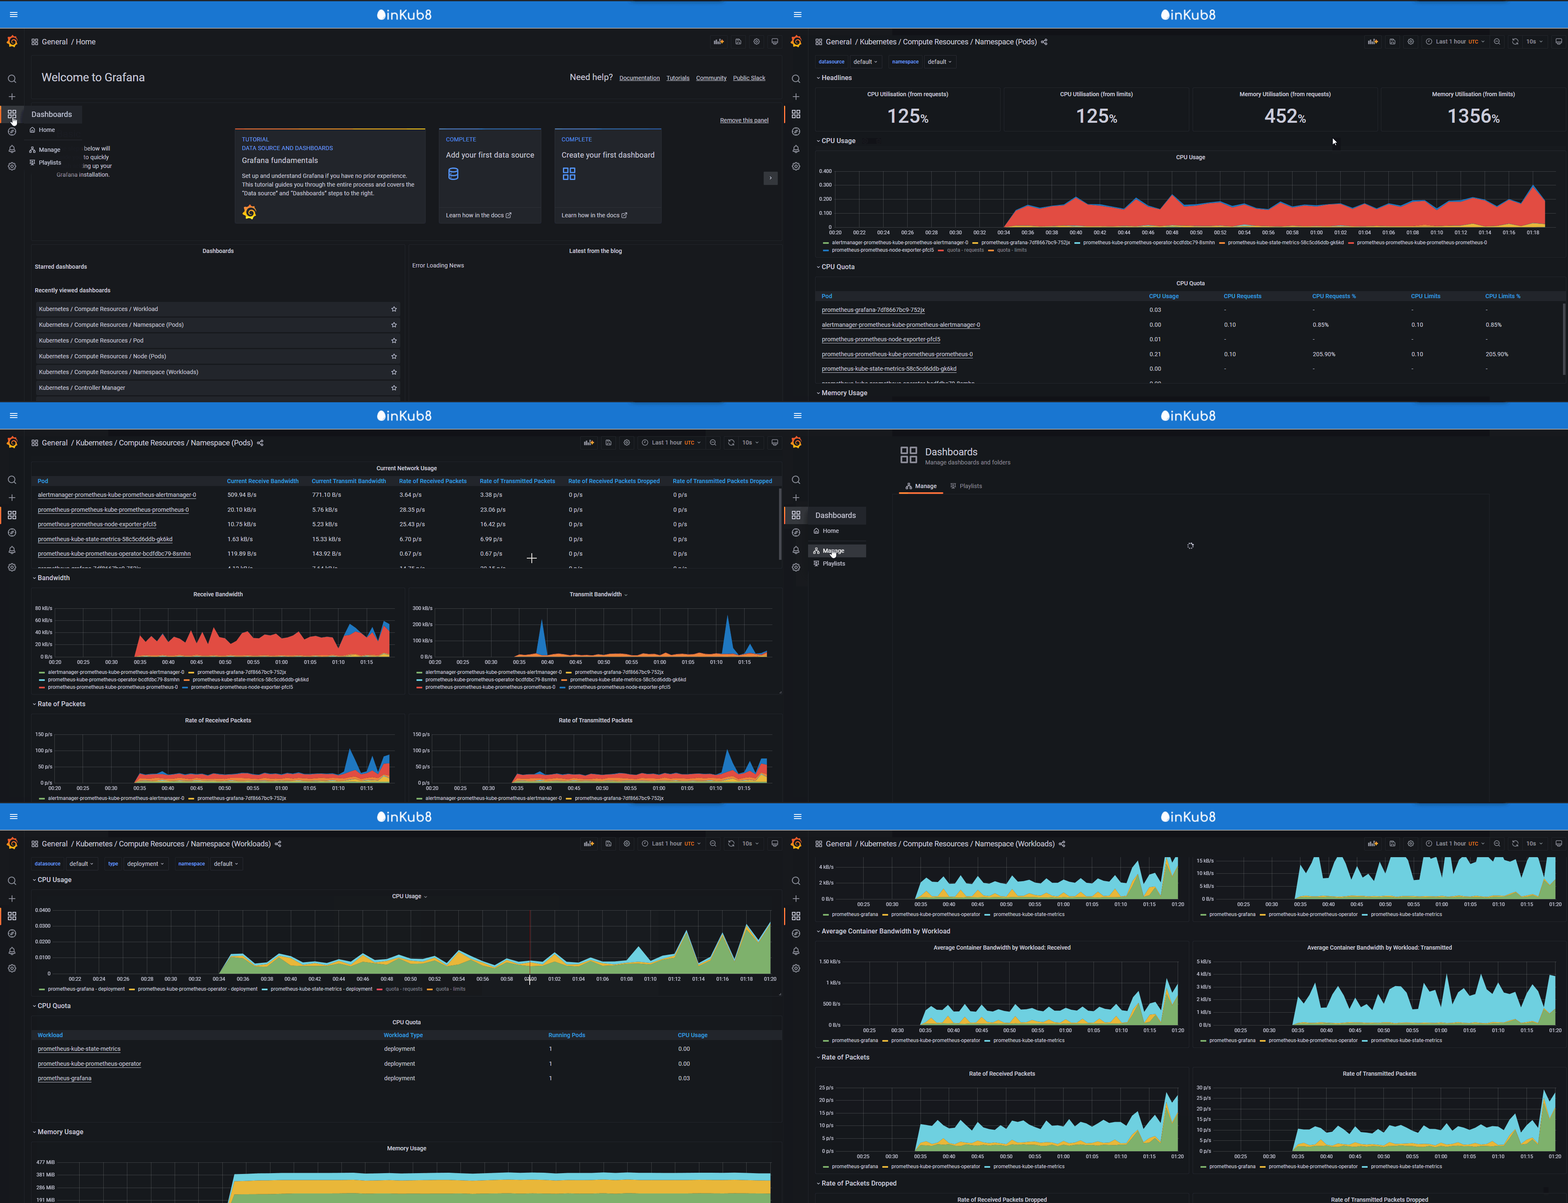
Our metrics page employs complete Grafana integration allowing the user to manage and organize their dashboards. These dashboards contain all the vital data a user will need to monitor their Kubernetes cluster including memory and CPU usage by pod, received/transmitted bandwidth, and average scrape interval duration.
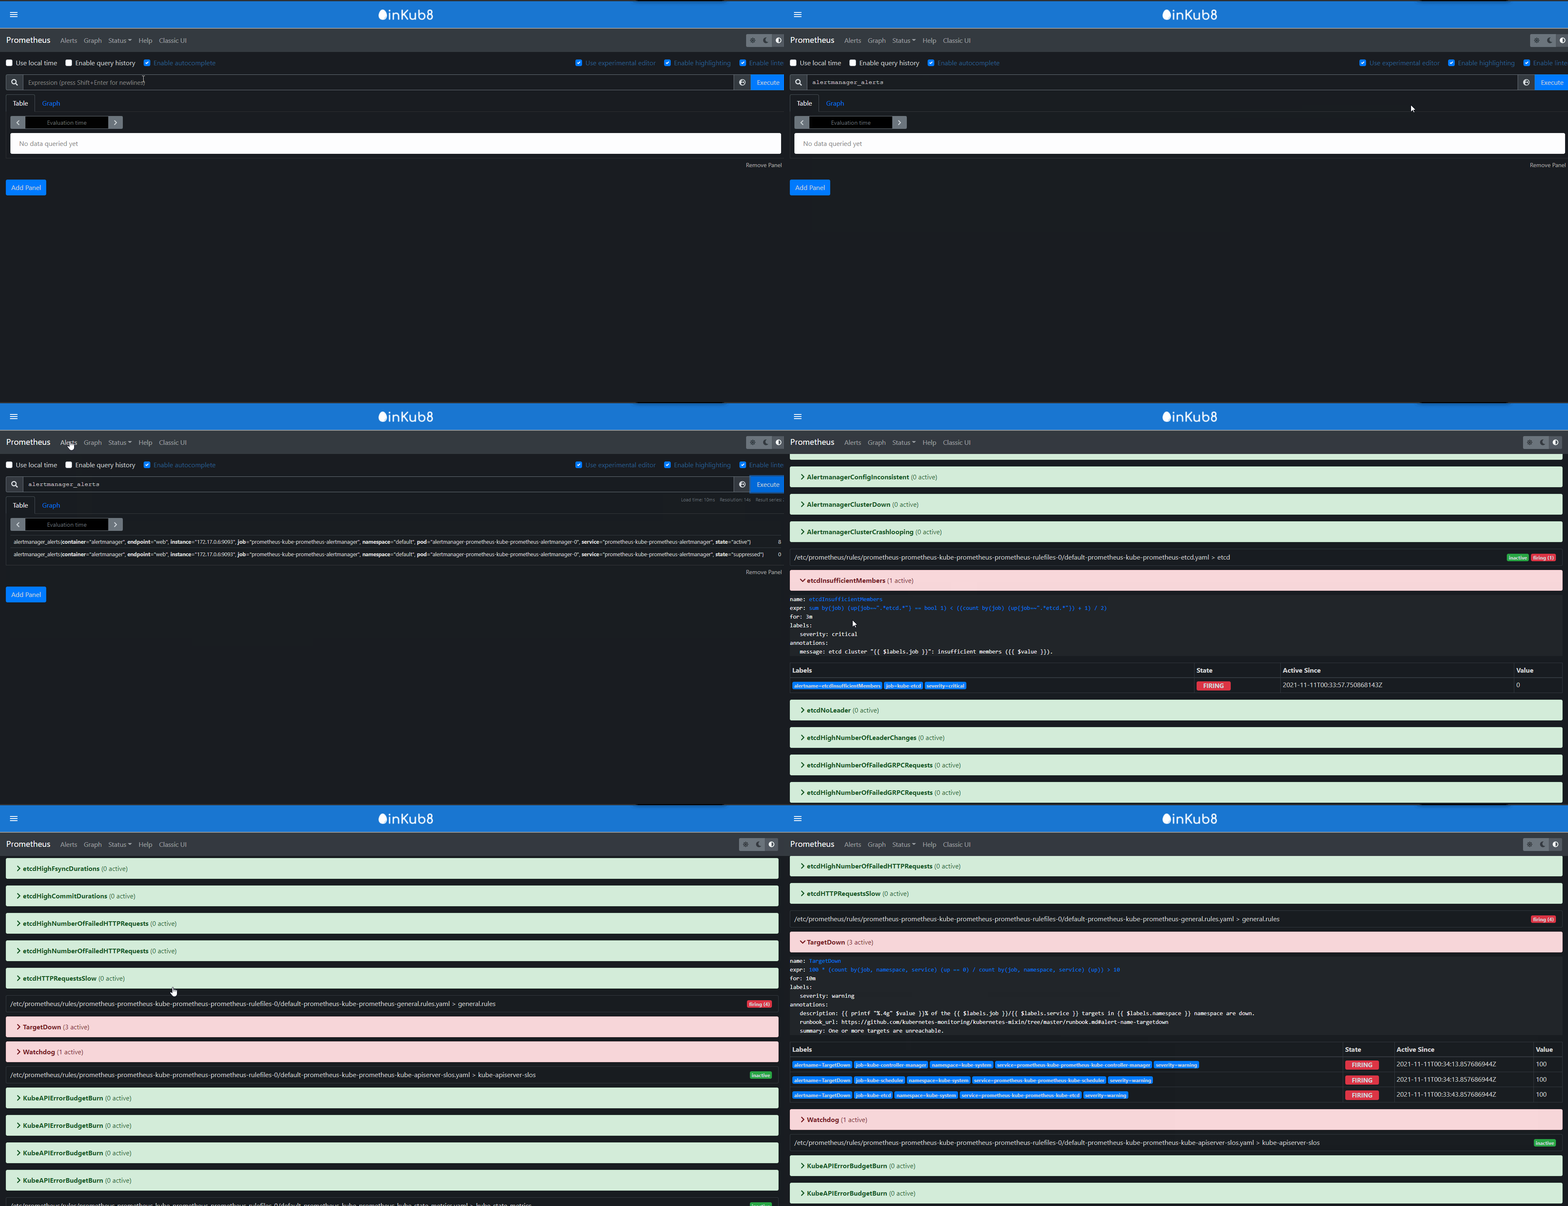
The Prometheus page exposes the full Prometheus dashboard, allowing you to view numerous alerts and execute PromQL queries
inKub8 must be used on the same machine where kubectl is configured in order to access your cluster. Also, you must have Prometheus and Grafana running in your cluster and port-forwarded to ports 9090 and 3000 respectively.To use the application, follow the following steps:
- Download the binary from the releases page of our GitHub and install
- If you don't already have Prometheus and Grafana deployed to your cluster, use Helm to deploy them:
Install Helm https://helm.sh/docs/intro/install/
Add the prometheus Helm chart by running the command
helm repo add prometheus-community https://prometheus-community.github.io/helm-chartsDeploy Prometheus and Grafana to your cluster by running the commandhelm install prometheus prometheus-community/kube-prometheus-stack - Port forward Prometheus to port 9090 and Grafana to port 3000.
If you installed using helm you can use the commands
kubectl port-forward deployment/prometheus-grafana 3000andkubectl port-forward pod/prometheus-prometheus-kube-prometheus-prometheus-0 9090 - Run inKub8. Your cluster information should be displayed!
- LinkedIn:https://www.linkedin.com/in/alielhawary/
- Github: https://github.com/alielhawary
- LinkedIn: https://www.linkedin.com/in/clintonquach/
- Github: https://github.com/klintonkuach
- LinkedIn: www.linkedin.com/in/danielwgeiger
- Github: https://www.linkedin.com/in/daniel-geiger-90792113/
•
- LinkedIn: https://www.linkedin.com/in/elijah-tang/
- Github: https://github.com/elijahtang
- LinkedIn: https://www.linkedin.com/in/gunnarmarino/
- Github: https://github.com/gunnarmarino
- InKub8 Website: inKub8.app
- inKub8 Github: https://github.com/oslabs-beta/inKub8
Installation
inKub8 must be used on the same machine where your kubectl is configured to access your cluster. Also you must have prometheus and grafana running in your cluster and port-forwarded to ports 9090 and 3000, respectively.
To use the application, follow the following steps:
Download the binary from the releases page of our github and install.
If you don't already have prometheus and grafana deployed to your cluster, use helm to deploy them.
Install Helm https://helm.sh/docs/intro/install/
Add the prometheus helm chart by running the command helm repo add prometheus-community https://prometheus-community.github.io/helm-charts
Deploy prometheus and grafana to your cluster by running the command helm install prometheus prometheus-community/kube-prometheus-stack
Port forward prometheus to port 9090 and grafana to port 3000.
If you installed using helm you can use the commands kubectl port-forward deployment/prometheus-grafana 3000 and kubectl port-forward pod/prometheus-prometheus-kube-prometheus-prometheus-0 9090
Run inKub8 and your cluster information should be displayed.


