numeric metric for calltree bitmap? #406
Comments
|
Good point to have a machine readable metric here. To be more precise, you are referring to this color map for extracting a numerical digest, right?
|

|
yep! |
|
The Runtime coverage analysis shown for each fuzzer gives a percentage of what is covered at runtime wrt to the statically reachable code for the given fuzzer, which is a numeric metric representation of the data shown in the calltree. Does this capture what you're looking for? if so, perhaps the UX around the data presentation should be improved? |

|
Related to this, it might be nice to include some form of historical data in fuzz introspector (i.e. data from many coverage analysis runs and/or static analysis runs) so that we can do data analysis on progress/deterioration. |
|
Thanks, it wasn't clear to me that this was the same metric -- i.e. is that number talking about functions or call sites? |
|
@DavidKorczynski would it make sense to clarify this part in the UI? Is this measuring covered functions / reachable functions or covered callsites / reachable callsites? Or am I horribly misunderstanding something here? |
It would. I'm working on improving doc and user experience these days. Will try to make this more intuitive.
The representation I showed is missing functions and not callsites which is what the calltree represents, which is what the bitmap shows. On that note I agree we should get a numeric representation of the callsites. Good catch. |
|
#420 fixes this in the following way: |
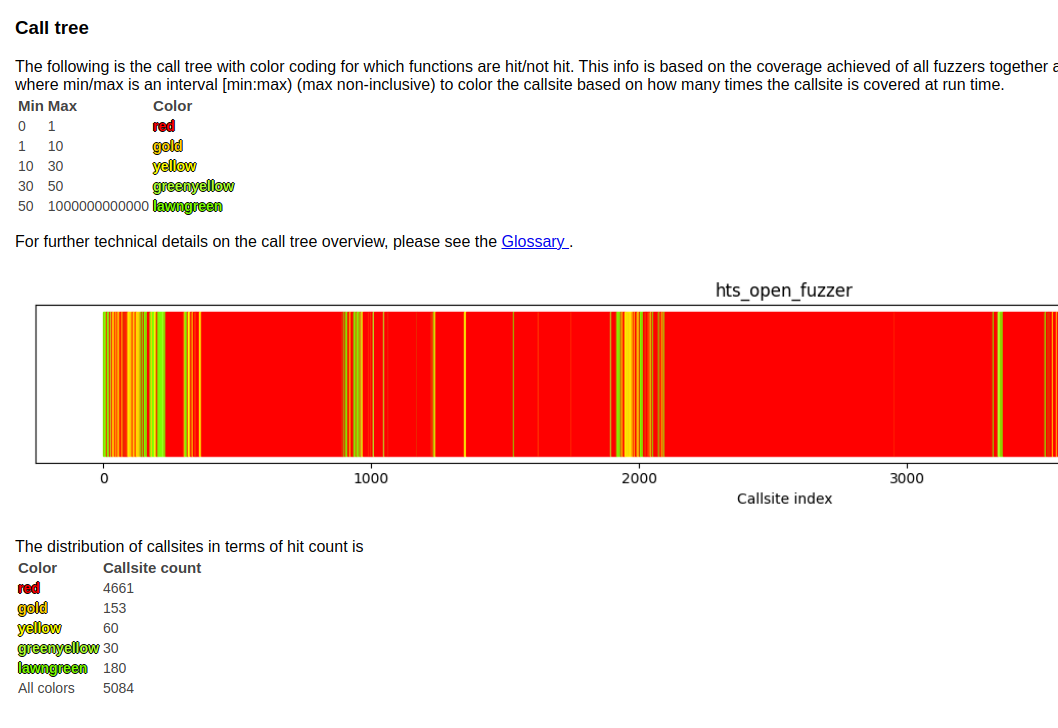
|
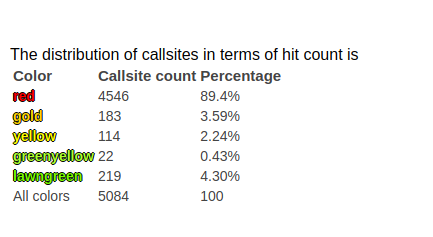
Minor update, to also show the percentage:
|
* report: add numeric represntation of calltree

Fixes: #406

* remove f strings when not needed

* Add percentage data

* rephrase
It may be useful for devs to compare the improvements they made wrt calltree bitmap. Right now the only way to do this is to eyeball the colouring on the report.
Would it make sense to add a percentage value here?
The text was updated successfully, but these errors were encountered: