game artificial intelligence
FSMs are good to separate discrete states that an agent can be in. It can work to code AI, especially if it’s an HFSM, but it’s still limited when compared with BTs.
BTs are good when the AI needs to react to changes and make decisions based on those changes dynamically.
You can also mix both, which is what I prefer.
There is also Goal Oriented Action Planning, which can give you unparalleled AI, but it’s inherently very hard to debug and documentation on it is pretty sparse.
From iRacing:
Each AI Driver Attribute influences the AI Driver during AI Events as follows:
- Relative Skill – A measure of how skillful this AI Driver is compared to the other AI Drivers in this AI Opponent Roster. A lower value results in slower cornering speeds and a less optimum driving line. A higher value results in faster cornering speeds and a more optimum driving line.
- Aggression – A measure of the AI Driver’s behavior when interacting with other cars. Low Aggression encourages more car spacing and less overtake attempts. High Aggression encourages tighter car spacing and more overtake attempts.
- Optimism – A measure of the AI Driver’s confidence in their own skill. A lower value results in more conservative throttle and braking behavior, such as lift and coast into a braking zone. A higher value results in more confident throttle and brake behavior, such as aiming for optimal acceleration and braking marks more often.
- Smoothness – A measure of the AI Driver’s steering behavior. A lower value results in more oversteer. A higher value results in more understeer.
- Age – The simulated age in years of the AI Driver. A value closer to prime racing age results in faster reaction times. As age increases, it also provides racing experience that can slightly improve overall performance.
- Pit Crew Skill – A measure of the training and consistency of the AI Driver’s pit crew. A lower value results in slower pit service times. A higher value results in optimal pit service times.
- Pitting Strategy Riskiness – A measure of the AI Driver’s likelihood to gamble with pit service. A lower value results in conservative pitting strategy. A higher value results in pushing the car to avoid pitting.
Distances at which Visual/Aural disturbances can be identified (Work out if an enemy is alerted to a muzzle flash for example)
https://www.alternatewars.com/BBOW/Visual_Aural_Distances.htm
We can use these to determine the radius of which enemies are alerted to muzzle flash, engine noises, shots fired, etc.
|
NOTE: Air observation doubles/triples these distances. |
|
|
Headlights of motor vehicles and tanks |
4-8 kilometers |
|
Muzzle flashes from single cannons |
4-5 kilometers |
|
Muzzle flashes from small arms |
1.5-2 kilometers |
|
Bonfire |
6-8 kilometers |
|
Flashlight |
up to 1.5 – 2 kilometers |
|
Light match |
up to 1.5 kilometers |
|
Lighted cigarette |
500 – 800 meters |
|
Reference: |
|
|
Cannon shot |
up to 15 kilometers |
|
Single shot from a rifle |
2-3 kilometers |
|
Automatic weapons fire |
3-4 kilometers |
|
Tanks |
up to 1.2 kilometers |
|
Tanks |
3-4 kilometers |
|
Motor
Vehicles |
up to 500 meters |
|
Motor
Vehicles |
up to 1 kilometer |
|
Troops
on Foot |
up to 300 meters |
|
Troops
on Foot |
up to 600 meters |
|
Small arms loading |
up to 500 meters |
|
Metal on metal |
up to 300 meters |
|
Conversation of a few men |
up to 300 meters |
|
Steps of a single man |
up to 40 meters |
|
Axe
blow or |
up to 500 meters |
|
Blows
of shovels |
up to 1,000 meters |
|
Screams |
up to 1,500 meters |
|
Oars on water |
up to 2,000 meters |
|
Reference: |
|
|
Sound |
Maximum Distance (m) |
|
Human speech |
100- 200 |
|
Stakes being pounded into the ground by hand |
300 |
|
Stakes being pounded into the ground mechanically |
500 |
|
Trenches being dug (shovel striking rocks or iron) |
500-1,000 |
|
Tree cutting, tree falling |
800 |
|
Automatic fire |
1,000-2,000 |
|
Single rifle shot |
3,000 |
|
Reference: |
|
|
Tree Description |
Distance (m) |
|
Trunk and main branches are visible. Foliage appears in cluster-like shape. Daylight may be seen through the foliage. |
1,000 |
|
Trunk is visible, main branches are distinguishable, foliage appears as smooth surface. Outlines of foliage of separate trees are distinguishable. |
2,000 |
|
Lower half of trunk is visible. Branches blend with foliage. Foliage blends with adjoining trees. |
3,000 |
|
Trunk and branches blend with foliage and appear as a continuous cluster, smooth in appearance. Movement of foliage caused by wind cannot be detected. |
4,000 |
|
The whole area covered by trees appears smooth and dark. |
5,000 and beyond |
|
Reference: |
|
|
Object Identified by the Unaided Eye |
Distance (m) |
|
Lone tree trunk |
1,000 |
|
Individuals and horsemen |
1,500 |
|
Chimneys on rooftops |
3,000 |
|
Windows in houses |
4,000 |
|
Individual houses in a populated area |
4,000 - 5,000 |
|
Villages and individual houses |
8,000 - 9,000 |
|
Large houses, towers, and steeples |
15,000 - 18,000 |
|
Reference: |
|
Calculating the Visibility Factor of an Aircraft (For working out if an enemy can see an aircraft without actually doing a ray cast)
VF = sqrt(FrontalArea^2 + SideArea^2 + PlanviewArea^2)
For reference, a F-4 has a VF of 1,200.
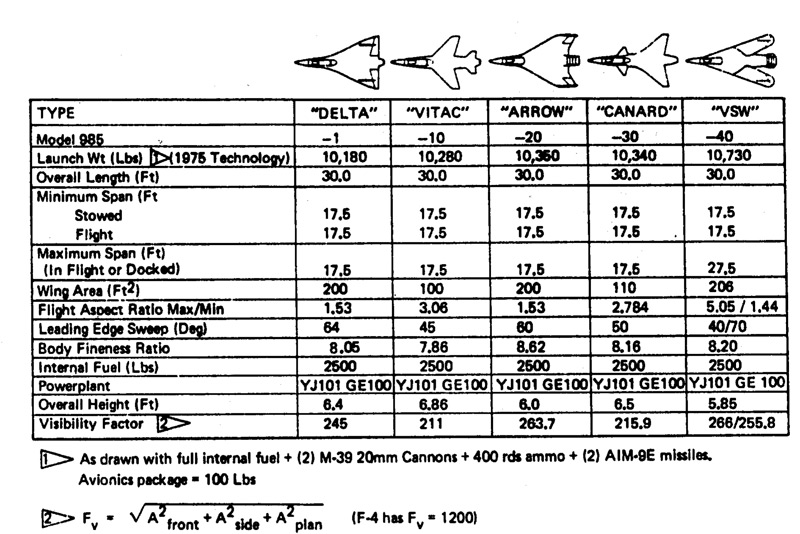
Can we use it to work out if an enemy sees an aircraft? Or should we just work out if the aircraft's position is within a viewing cone, and what proportion the aircraft's bounding box/sphere takes up within that view?
https://www.alternatewars.com/BBOW/Aviation/Air_Vehicle_Turn_Radius.htm
R = V^2 / A
R = Turning Radius of air vehicle in meters
V = Velocity of air vehicle in meters per second
A = Turning acceleration capability of air vehicle in meters/sec2
Example
A supersonic anti-ship missile traveling at Mach 1.5 at sea level (510 m/sec) and with a turn capability of 10 gees (98 m/sec2). What is it's turn radius?
5102 / 98 = 2,654~ meters
|
TYPE |
Speed (MPH) |
Speed (kts) |
Speed (km/hr) |
Speed (m/sec) |
Average “Bare” Human |
Late 20th Century Jet Pilot
(G-Suit) |
||||||
|
Turn Radius (ft) |
Turn Radius (m) |
Turn Radius (miles) |
Turn Radius (km) |
Turn Radius (ft) |
Turn Radius (m) |
Turn Radius (miles) |
Turn Radius (km) |
|||||
|
|
50 |
43.45 |
80.47 |
22.35 |
33.43 |
10.19 |
0.0063 |
0.0102 |
18.57 |
5.66 |
0.0035 |
0.0057 |
|
WW1 Biplanes |
100 |
86.90 |
160.93 |
44.70 |
133.72 |
40.76 |
0.0253 |
0.0408 |
74.29 |
22.64 |
0.0141 |
0.0226 |
|
|
200 |
173.80 |
321.87 |
89.41 |
534.87 |
163.03 |
0.1013 |
0.1630 |
297.15 |
90.57 |
0.0563 |
0.0906 |
|
|
300 |
260.69 |
482.80 |
134.11 |
1,203.45 |
366.81 |
0.2279 |
0.3668 |
668.59 |
203.78 |
0.1266 |
0.2038 |
|
WW2 Monoplanes |
400 |
347.59 |
643.74 |
178.82 |
2,139.47 |
652.11 |
0.4052 |
0.6521 |
1,188.60 |
362.28 |
0.2251 |
0.3623 |
|
WW2 Jets |
500 |
434.49 |
804.67 |
223.52 |
3,342.93 |
1,018.92 |
0.6331 |
1.0189 |
1,857.18 |
566.07 |
0.3517 |
0.5661 |
|
F-86/MiG-15 |
600 |
521.39 |
965.60 |
268.22 |
4,813.82 |
1,467.25 |
0.9117 |
1.4673 |
2,674.34 |
815.14 |
0.5065 |
0.8151 |
|
|
700 |
608.28 |
1,126.54 |
312.93 |
6,552.14 |
1,997.09 |
1.2409 |
1.9971 |
3,640.08 |
1,109.50 |
0.6894 |
1.1095 |
|
|
800 |
695.18 |
1,287.47 |
357.63 |
8,557.90 |
2,608.45 |
1.6208 |
2.6084 |
4,754.39 |
1,449.14 |
0.9005 |
1.4491 |
|
F-100 / MiG-19 |
900 |
782.08 |
1,448.41 |
402.34 |
10,831.09 |
3,301.32 |
2.0513 |
3.3013 |
6,017.27 |
1,834.06 |
1.1396 |
1.8341 |
|
|
1,000 |
868.98 |
1,609.34 |
447.04 |
13,371.72 |
4,075.70 |
2.5325 |
4.0757 |
7,428.73 |
2,264.28 |
1.4070 |
2.2643 |
|
MiG-21 |
1,250 |
1,086.22 |
2,011.68 |
558.80 |
20,893.31 |
6,368.28 |
3.9571 |
6.3683 |
11,607.39 |
3,537.93 |
2.1984 |
3.5379 |
|
F-104 |
1,500 |
1,303.46 |
2,414.01 |
670.56 |
30,086.36 |
9,170.32 |
5.6982 |
9.1703 |
16,714.64 |
5,094.62 |
3.1657 |
5.0946 |
|
|
1,750 |
1,520.71 |
2,816.35 |
782.32 |
40,950.88 |
12,481.83 |
7.7558 |
12.4818 |
22,750.49 |
6,934.35 |
4.3088 |
6.9343 |
|
|
2,000 |
1,737.95 |
3,218.68 |
894.08 |
53,486.86 |
16,302.80 |
10.1301 |
16.3028 |
29,714.92 |
9,057.11 |
5.6278 |
9.0571 |
|
SR-71 (M3.32) |
2,200 |
1,911.75 |
3,540.55 |
983.49 |
64,719.10 |
19,726.38 |
12.2574 |
19.7264 |
35,955.06 |
10,959.10 |
6.8097 |
10.9591 |
https://www.alternatewars.com/BBOW/Railroads/NA_Railroad_Curve_Speeds.htm
Federal Railroad Administration – Track Compliance Manual Chapter 6 (1 January 2002)
Comparison of Upgrades Needed to Recognize Difference in Curve Speeds
This calculates the maximum allowable operating speed in MPH, but could be rearranged to work out the degree of curvature
Vmax = sqrt( (Ea + Eu) / (0.0007 * D) )
Vmax = Maximum allowable operating speed in MPH
Ea = Amount of super-elevation of outside rail over inside rail on a curve in inches. Limited to 6” usually in the US, and often lower to reduce wear on inner rail from heavy freights
Eu = Unbalanced Elevation in Inches. Restricted to 3” in USA, though up to 7” has been granted to the Acelas by waiver. European systems can have up to 11.8” of this to permit tilting HSR
D = Degree of curvature in degrees per 100 feet