"Could not get any response" on all my api calls #3127
Comments
|
@jmbremmer Could you open |
|
|

|
So I believe I have fixed the issue by turning off "Automatically follow redirects". Not sure why that fixes the issue, but so far my requests are going through as expected now. |
|
I have this same issue, though turning off automatically follow redirects did not solve the issue. the request seems to work on the chrome app version, 4.11 on both |
|
@jmbremmer Could your service be redirecting to a URL that was problematic? That might explain why it was temperamental. @birdbrained Usually when you get this error, you'd want to check your service to see if it is behaving properly (maybe check a status endpoint). Also, do you guys have a request timeout set? That might also explain the intermittent failures. |
|
I have this same issue, though turning off automatically follow redirects did not solve the issue? here is my console after some time it show this
data sent through post is arrived on server. But could not get any response from server. |


|
I disabled "Send Postman Token Header" in options and the issue is gone. I use custom header 'X-Auth-Token' - I guess there is some kind of conflict with 'Postman-Token' header. My Postman version: v5.1.3, Windows 10. |
|
I had the same issue. It was caused by a newline at the end of the "Authorization" header's value, which I had set manually by copy-pasting the bearer token (which accidentally contained the newline at its end) |
|
We also had similar issues, and it was really strange because on my mac it was working fine, and on other mac it was giving "Could not get any response", both same 5.2.0 version. So I think the issue was that I was using independent postman.app downloaded from website, and other mac was using Google Apps version as that versions doesn't have Postman Console in the View. We downloaded standalone app and now it is working.. Hope it helps. |
|
Guys I am closing this issue because I think the bug is not related to Postman. If you feel its a bug in Postman feel free to reopen this issue. |
|
I'm running into this same issue. I've tried the solutions provided above, but none work. vers. 5.2.1 From what I can tell, it's specific to Postman, as I have to rely on Fiddler to actually see the response coming back from our app. Here's the response, captured by fiddler, that isn't displayed in Postman. Maybe something sticks out... HTTP/1.1 200 OK {"access_token":"eyJ0eXAiOiJKV1QiLCJhbGciOiJTUzI1NiIsIng1dCI6ImEzck1VZ01Gdjl0UGNsTGE2eUYzekFrZnF1RSIsImtpZCI6ImEzck1VZ01Gdjl0UGNsTGE2eUYzekFrZnF1RSJ9.eyJpc3MiOiJodHRwczovL2xvY2FsLmRlYWxlcnNvY2tldC5jb20iLCJhdWSiOiJodHRwczovL2xvY2FsLmRlYWxlcnNvY2tldC5jb20vcmVzb3VyY2VzIiwiZXhwIjoYNTA3MTU4OTY0LCJuYmYiOjE1MDcxNTE3NjQsImNsaWVudF9pZCI6ImNybV90ZXN0Iiwic2NvcGUiOlsiYXBpIiwiYmxhY2tiaXJkIiwiZW1haWwiLCJvcGVuaWQiLCPwcm9maWxlIiwic2VhcmNoIiwid3JpdGUiXSwic3ViIjoiMmMyMTZlYmUtOTEzYi00ZGEyLWI3ZTctMWRkMWU2NTZkNWUxIiwiYXV0aF90aW1lIjoxNTA3MTUxNzY0LCJpZHAiOiJpZHNydiIsImFjY291bnRfdXNlcm5hbWUiOiJhdXRvYmIxIiwiY3JtX2RlYWxlcnNoaXAiOiI5Mjg2OCIsImRlYWxlcnNoaXAiOiI5Mjg2OCIsImFkbWluX3JvbGUiOiJzc28iLCJjcm1fdXNlcm5hbWUiOiJhdXRvYmIxIiwiYW1yIjpbInBhc3N3b3JkIl19.J6-rpO3-BLkFHuT8TH-CUasJj5levZzVMH1yYYw5mx35-GreIZbK9aL13K21clbvbQjeSbnMknHRLe5agSA7OkBiMU3hL8cNj20tjGBAkjbcwanPBiKefcC9YWtX7HHFAoZlckjFXx02e_V8jNdKOmOIaFW6-mfYNSWaKi1umGGnhyelkQ4la3dXq3nyD17rshv6BMH5fAS3r2K0TI7iZRwmV-1ZjaFKl10EgFAkIgiCSh-J18eP8O72I5we9CDO5ZHFxjKbsRWpfvuvViOEV1TihXhJYU2XJpW3DEU_pRuPR7fly0Hhvbjyj3HVdEPmV3_80gojtWUlbjEnLmqSxA","expires_in":7200,"token_type":"Bearer"} |
|
seeing this too in standalone app, but not in chrome extension/app |
|
Any insight into this issue? Postman is rendered useless for me until this can be figured out. I have automation that runs on my same dev machine that issues the same requests w/ out a problem. It's only when using Postman when requests aren't responding in Postman properly. I've talked to IT about whether it's our anti-virus causing issues, and we've determined it's not. If anything, can we have access to older, Windows versions so I can troubleshoot better which version this started w/ for me? |
|
Yes I have the same issue with the stand alone version 5.3.2 |
|
I figured out what was wrong (for me), and it's completely user error and I'm an idiot. At some point I set the timeout to some tiny amount (in ms) and some/most of my requests wouldn't respond in time. I'd love it if a Postman upgrade changed this from seconds to ms, so I can feel better about my stupidity, but I doubt that's the case... |
|
I'm facing the same issue, local proxy shows the request responded with correct data, but Postman the standalone app didn't show it, instead, it gives an Error: socket hang up. If it's not a Postman issue, maybe it's about Electron? Edited: In my case, if I disable the proxy setting, it works just fine. |
|
@numaanashraf @prashantagarwal
Error: socket hang up is related to mongoose. Solution |

|
Having the same issue.
|
|
Having this issue too. Just trying to switch away from the chrome app. Have a simple WebAPI service exposing a GET method with no auth and no params. Chrome Browser (v62) - Succeeds |
|
Check your system host config. That's how I fixed this. |
|
Hi This issue is resolved for me. setting ->general -> Requesttimeout in ms = 0 |
|
mine was set to 0 already and i am seeing it, so thats not it |
|
I account the same problem, I solved it by check the environment. |
|
I account with the same problem after update on Postman for Linux Version 5.4.1.
Answer from Nginx 172.18.0.1 - - [05/Dec/2017:09:59:11 +0000] "DELETE /api/event/1/history/3 HTTP/1.1" 204 880 "-" "PostmanRuntime/7.1.1" |

|
@maxnag can you let us know the response headers you received? |
|
Hi. I'm also havind this issue in the windows app. Using the chrome extension works fine! :/ |
|
I tried using your suggestion, but it didn't work for me. Here is my code: const Promise = require("bluebird");
const mongoose = Promise.promisifyAll(require("mongoose"));
import User from "../models/user.server.model";
const users = {
list: (req, res, next) => {
User.find({}, (err, users) => {
if (err) return next(err);
else res.status(200).json(users);
});
},
create: (req, res, next) => {
const user = new User(req.body);
user.save(err => {
if (err) return next(err);
else res.status(200).json(user);
});
},
read: (req, res) => {
res.json(req.user);
},
userById: (req, res, next, id) => {
User.findOne(
{
_id: id
},
(err, user) => {
if (err) return next(err);
else {
req.user = user;
next();
}
}
);
},
update: (req, res, next) => {
User.findByIdAndUpdate(req.user.id, req.body, {
new: true
}),
(err, user) => {
if (err) return next(err);
else res.status(200).json(user);
};
}
};
export { users as default };I keep getting
Any suggestions? |
|
I was facing the same issue. I resolved it by applying the fix no. 2 mentioned in the error message. i.e. Switching off SSL Certificate Verification.
|

|
This is postman- This is App.js file where i am set localhost- And this is back-end sever.js file- Sent all screen shots please show me error where i am wrong. |


|
Was facing this same issue with native app. Fixed it by disabling the 'SSL certificate verification' in Settings>General.
|

|
Also getting the same error after updating to v6.0.10 Here's the error on the console:
Any idea on this issue? |


|
@chrislandeza This seems the request is going via your local proxy. |
|
Saw this or a similar issue in the desktop app upon install when using a proxy. Timeout was set to 0 by default. Changed it to 90, no change. Later noticed it was in ms, not seconds, so increased it significantly, and it started working. Set it back to 0 again and it still works. Changed a bunch of other settings mentioned here too but always reverted them. |
|
@anreddy018 |

|
@anreddy018 |
|
It worked for me when I turned off the SSL |
|
got the same issue here.. it happened because im using header for "Access-Control-Allow-Origin" in my controller. Remove it and it will work, but make sure u put it back after u test it using Postman. These never happened before |
|
I also got the same issue but in my case, it was because it was a new install and I forgot to set the store's design config before making authenticated requests with an admin bearer token to create a customer via REST API. And weirdly enough, it let me get my admin bearer token via API but I couldn't make any requests with Postman after I had the token. Anyway, if that sounds like your case, check your site's Swagger page instead of Postman. If paste your bearer token in the field at the top right, make a request, and you receive this response (which doesn't show in Postman): Then your solution is likely to login to the admin, check Content>Configuration>Global (or relevant area's config), and make sure there's a theme configured for you new install. If that doesn't work, make sure to double test your request again on the Swagger page or with curl instead of with Postman. So https://yoursite.com/swagger/ . Hopefully one of the solutions in this post solves this issue for everyone because it seems to be way too common with Postman haha |
|
In my case one of the keys in the header was wrong. After trying different settings in File->Settings->General without luck I opened the Postman-console and there was the error message: Error: Header name must be a valid HTTP Token ["client_secret ClientSecret"]. So a copy & paste error in one Header Key was the problem. Maybe it helps. |
|
@zabbarob Thanks! I had the same issue! |
|
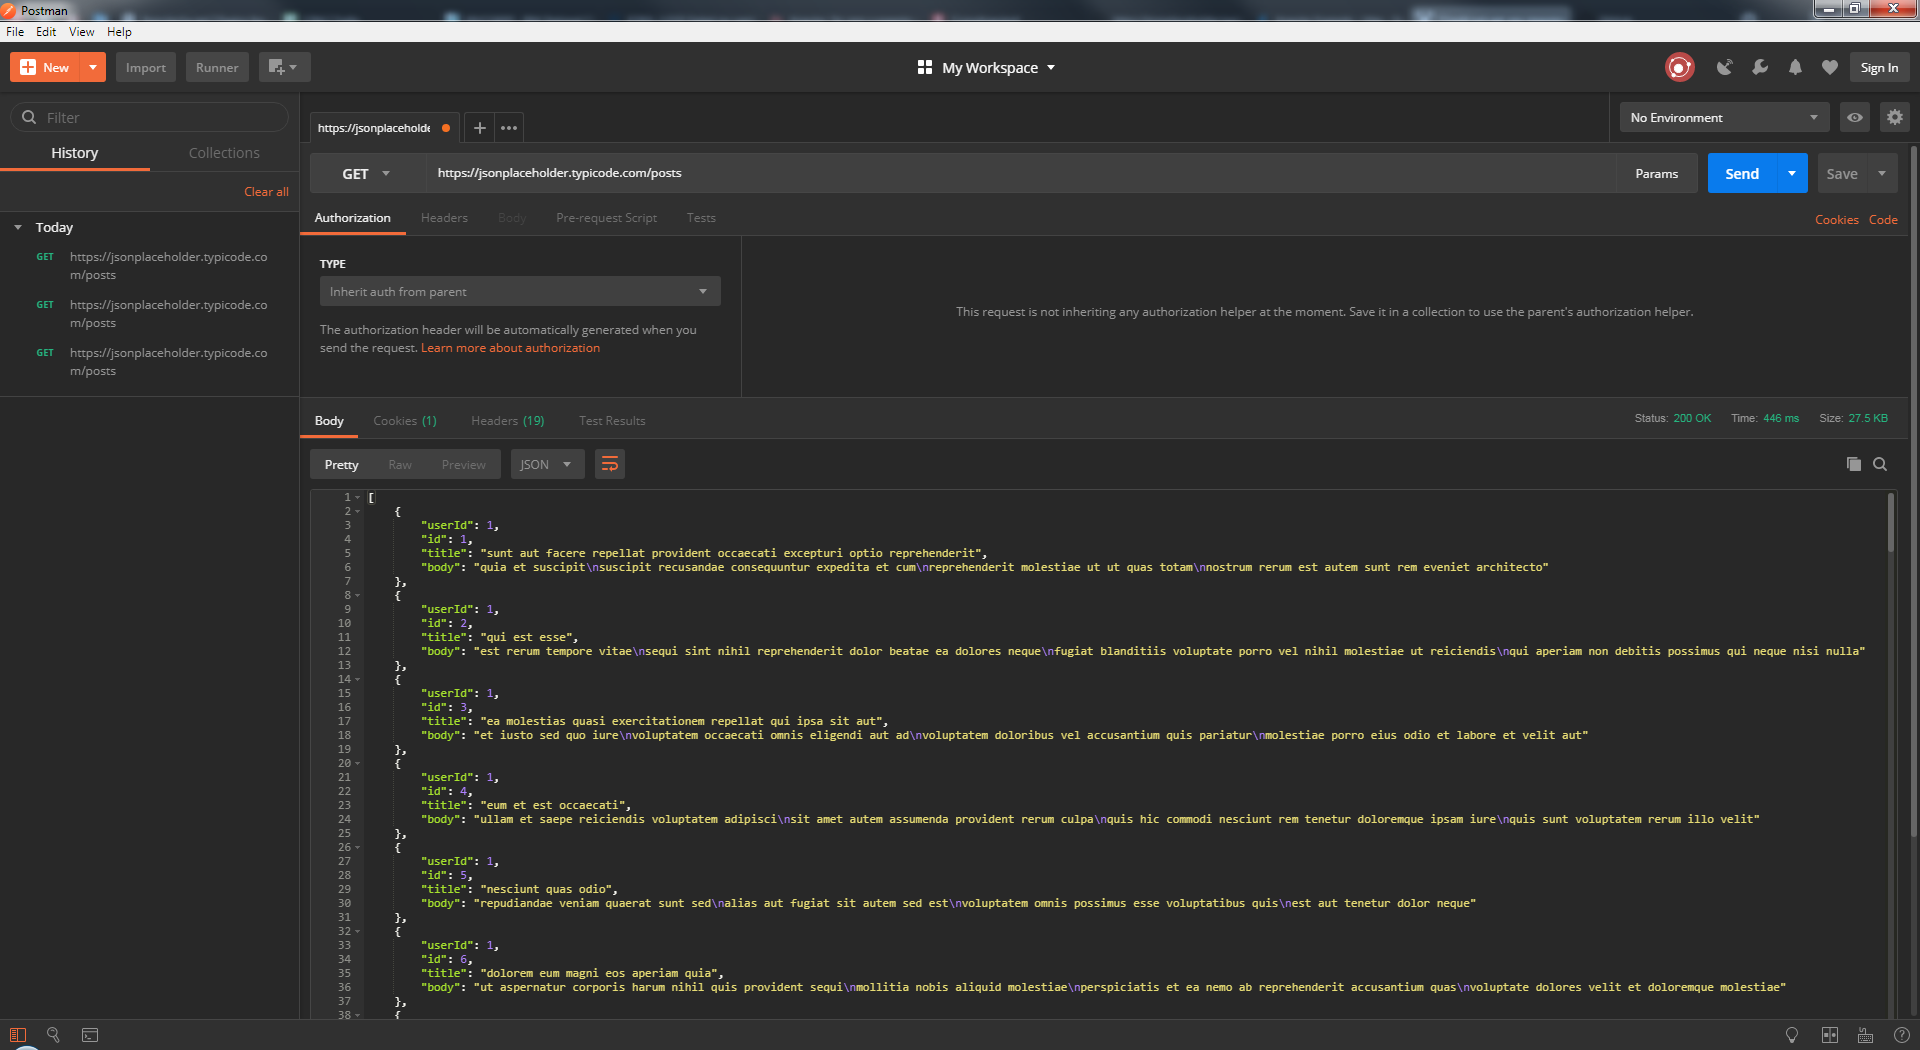
I have the same issue sending request to my API. The funny thing is that if I send a request to another API (https://jsonplaceholder.typicode.com/posts) it works correctly. I've done all the things that everyone commented on this post and it doesn't seems to work. Postman Version: 6.1.4 Postman requesting my API: Postman Console: Postman requesting online API: |


|
@Magdiel Could you try hitting your localhost API via curl in Command Prompt and send us the logs? |

|
Thanks @Magdiel. Is this the response you expected when you used Postman? |
|
@numaanashraf this is the response I expect in Postman. In the browser the response is as expected
|

|
@Magdiel Can you try the cURL command once more with follow redirect flag and verify that it is the response you expected? |
|
@numaanashraf this is the result I'm expecting This is what Im getting with curl: |


|
@numaanashraf thanks. |
|
Just downloaded Postman from https://www.getpostman.com/apps, installed it on Ubuntu 18.04, and I am experiencing this also:
|
|
@programarivm Thanks for writing in. Could you open the Postman Console (View > Show Postman Console), resend the request and check if there are any errors there? |
|
Thank you @numaanashraf for the prompt response. Issue fixed. It was my Vagrant set up modifying the |
|
@programarivm Glad to know this is resolved at your end. 😄 |
|
There are several unrelated request sending issues being posted on this thread as they all have the same symptom of 'Could not get any response'. This prevents us from tracking these issues individually, suggest possible workarounds and post updates on bug fixes and rollouts to our stable and canary channels. We are locking this thread to prevent further posts of unrelated issues. If you get a |
I can sometimes resolve the issue by restarted Postman, but that no longer seems to be working. I know that everything is correct because when I run it in terminal via cURL, it works fine. Also, I do have ssl cert verification turned off
Version 4.11.1 (4.11.1)
Mac app
Version 10.11 (15A284)
Not sure
Happens frequently over the last few months
Nothing in the logs
The text was updated successfully, but these errors were encountered: