profiler.export_stacks doesn't return stack trace unless experimental_config is provided #100253
Comments
|
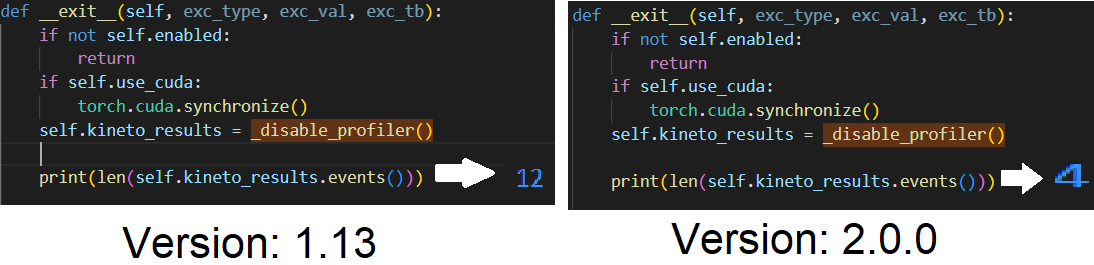
I traced your code and found the following, the issue is in the profile object (prof) the above line gives 2 different results in the 2 torch versions, it should return the list of events that will be parsed to create the stack trace you need. It was working fine in torch version = 1.13.0 but in 2.0.0 it seems to be not working I couldn't see its source code. Here is a test:- In version 2.0.0 the returned list of events can't be parsed by the subsequent functions, so the stack traces are all empty which resulted in giving you an empty file. I traced all other functions and found they are exactly the same between the 2 versions. |
|
Hi @Zeyad-Abdelreheem thanks, at least i can eliminate a problem on my side if it's reproducable. Any idea who to |
|
Hey! Also tentative high priority. |
|
Any updates on this? |
|
Will take an ai to find a PoC and figure out how it missed regression testing during the release. |
|
Hi @NicolayP, our profiler team has recorded this issue, and will assign a POC to look into the issue. There was a significant rework to the profiler in the past year, and this regression may have been caused by that. Sorry for the inconvenience. |
|
Bisect still in progress but looks likely to be from #86263, will take a closer look tomorrow after the bisect finishes. |
|
It looks like you can turn this back on with this: ...
with profile(with_stack=True, profile_memory=True, experimental_config=torch._C._profiler._ExperimentalConfig(verbose=True)) as prof:
...However, this doesn't show all the same information as it used to; I'll continue investigating |
|
hi @davidberard98 friendly checking in a bit, do we by chance have any update on this issue? Thanks! |
|
We don't have any immediate plans to change this behavior; you should use the experimental_config option if you want this feature. |
|
It seems like with |
|
Any update on this? I've been running into the same issue in both 2.0 and 2.1. No stack information |
|
No stack information on torch 2.2.0, but |
|
Hi, is there any updates? This bug seems to still be there with latest pytorch. |
|
Can confirm that on 2.2.0, even with the experimental_config as described above, output stack traces are empty. |
|
This worked on pytorch 2.2.2+cu121 I have to say... there is a huge difference between knowing you have 3.8Gb allocated from aten::empty.. and knowing you have 3.8Gb allocated from torch/nn/functional.py(2451): batch_norm The latter is a lot more actionable that the former. |
|
It seems |
|
For me it's not working either with or without experimental config on |
Summary: Many users have been complaining that with stack does not work on its own as described in the our pytorch tutorials. If used it returns an empty python stack. It only returns a stack if JIT is enabled. pytorch#89406 pytorch#95238 pytorch#100253 pytorch#117515 Test Plan: Edited unit test to only contain with_stack Differential Revision: D58149768
🐛 Describe the bug
Since I upgraded torch from
1.13.0+cu117to2.0.0+cu117, the following code isn't logging nor printing the stack trace.for
1.13.0+cu117the file is logged correctly:for
2.0.0+117cuhowever, I get an empty file. Is there something I'm missing?Versions
For the env with torch 1.13.0
Collecting environment information...
PyTorch version: 1.13.0+cu117
Is debug build: False
CUDA used to build PyTorch: 11.7
ROCM used to build PyTorch: N/A

OS: Ubuntu 18.04.6 LTS (x86_64)
GCC version: (Ubuntu 7.5.0-3ubuntu1~18.04) 7.5.0
Clang version: Could not collect
CMake version: version 3.10.2
Libc version: glibc-2.27

Python version: 3.9.15 (main, Nov 24 2022, 14:31:59)  [GCC 11.2.0] (64-bit runtime)
Python platform: Linux-5.4.0-147-generic-x86_64-with-glibc2.27
Is CUDA available: True
CUDA runtime version: Could not collect
CUDA_MODULE_LOADING set to: LAZY
GPU models and configuration: GPU 0: NVIDIA GeForce GTX 1650
Nvidia driver version: 525.105.17
cuDNN version: Probably one of the following:
/usr/lib/x86_64-linux-gnu/libcudnn.so.8.8.1
/usr/lib/x86_64-linux-gnu/libcudnn_adv_infer.so.8.8.1
/usr/lib/x86_64-linux-gnu/libcudnn_adv_train.so.8.8.1
/usr/lib/x86_64-linux-gnu/libcudnn_cnn_infer.so.8.8.1
/usr/lib/x86_64-linux-gnu/libcudnn_cnn_train.so.8.8.1
/usr/lib/x86_64-linux-gnu/libcudnn_ops_infer.so.8.8.1
/usr/lib/x86_64-linux-gnu/libcudnn_ops_train.so.8.8.1
/usr/local/cuda-11.7/targets/x86_64-linux/lib/libcudnn.so.8
/usr/local/cuda-11.7/targets/x86_64-linux/lib/libcudnn_adv_infer.so.8
/usr/local/cuda-11.7/targets/x86_64-linux/lib/libcudnn_adv_train.so.8
/usr/local/cuda-11.7/targets/x86_64-linux/lib/libcudnn_cnn_infer.so.8
/usr/local/cuda-11.7/targets/x86_64-linux/lib/libcudnn_cnn_train.so.8
/usr/local/cuda-11.7/targets/x86_64-linux/lib/libcudnn_ops_infer.so.8
/usr/local/cuda-11.7/targets/x86_64-linux/lib/libcudnn_ops_train.so.8
HIP runtime version: N/A
MIOpen runtime version: N/A
Is XNNPACK available: True

CPU:
Architecture:        x86_64
CPU op-mode(s):      32-bit, 64-bit
Byte Order:          Little Endian
CPU(s):              16
On-line CPU(s) list: 0-15
Thread(s) per core:  2
Core(s) per socket:  8
Socket(s):           1
NUMA node(s):        1
Vendor ID:           GenuineIntel
CPU family:          6
Model:               158
Model name:          Intel(R) Core(TM) i9-9980HK CPU @ 2.40GHz
Stepping:            13
CPU MHz:             964.671
CPU max MHz:         5000.0000
CPU min MHz:         800.0000
BogoMIPS:            4800.00
Virtualisation:      VT-x
L1d cache:           32K
L1i cache:           32K
L2 cache:            256K
L3 cache:            16384K
NUMA node0 CPU(s):   0-15
Flags:               fpu vme de pse tsc msr pae mce cx8 apic sep mtrr pge mca cmov pat pse36 clflush dts acpi mmx fxsr sse sse2 ss ht tm pbe syscall nx pdpe1gb rdtscp lm constant_tsc art arch_perfmon pebs bts rep_good nopl xtopology nonstop_tsc cpuid aperfmperf pni pclmulqdq dtes64 monitor ds_cpl vmx est tm2 ssse3 sdbg fma cx16 xtpr pdcm pcid sse4_1 sse4_2 x2apic movbe popcnt tsc_deadline_timer aes xsave avx f16c rdrand lahf_lm abm 3dnowprefetch cpuid_fault epb invpcid_single ssbd ibrs ibpb stibp ibrs_enhanced tpr_shadow vnmi flexpriority ept vpid ept_ad fsgsbase tsc_adjust bmi1 avx2 smep bmi2 erms invpcid mpx rdseed adx smap clflushopt intel_pt xsaveopt xsavec xgetbv1 xsaves dtherm ida arat pln pts hwp hwp_notify hwp_act_window hwp_epp md_clear flush_l1d arch_capabilities

Versions of relevant libraries:
[pip3] numpy==1.23.5
[pip3] torch==1.13.0
[pip3] torchaudio==0.13.0
[pip3] torchvision==0.14.0
[conda] cudatoolkit               11.0.3              h88f8997_10    conda-forge
[conda] numpy                     1.23.5                   pypi_0    pypi
[conda] torch                     1.13.0                   pypi_0    pypi
[conda] torchaudio                0.13.0                   pypi_0    pypi
[conda] torchvision               0.14.0                   pypi_0    pypi
For torch 2.0.0:
Collecting environment information...
PyTorch version: 2.0.0+cu117
Is debug build: False
CUDA used to build PyTorch: 11.7
ROCM used to build PyTorch: N/A

OS: Ubuntu 18.04.6 LTS (x86_64)
GCC version: (Ubuntu 7.5.0-3ubuntu1~18.04) 7.5.0
Clang version: Could not collect
CMake version: version 3.26.3
Libc version: glibc-2.27

Python version: 3.9.16 (main, Mar  8 2023, 14:00:05)  [GCC 11.2.0] (64-bit runtime)
Python platform: Linux-5.4.0-147-generic-x86_64-with-glibc2.27
Is CUDA available: True
CUDA runtime version: Could not collect
CUDA_MODULE_LOADING set to: LAZY
GPU models and configuration: GPU 0: NVIDIA GeForce GTX 1650
Nvidia driver version: 525.105.17
cuDNN version: Probably one of the following:
/usr/lib/x86_64-linux-gnu/libcudnn.so.8.8.1
/usr/lib/x86_64-linux-gnu/libcudnn_adv_infer.so.8.8.1
/usr/lib/x86_64-linux-gnu/libcudnn_adv_train.so.8.8.1
/usr/lib/x86_64-linux-gnu/libcudnn_cnn_infer.so.8.8.1
/usr/lib/x86_64-linux-gnu/libcudnn_cnn_train.so.8.8.1
/usr/lib/x86_64-linux-gnu/libcudnn_ops_infer.so.8.8.1
/usr/lib/x86_64-linux-gnu/libcudnn_ops_train.so.8.8.1
/usr/local/cuda-11.7/targets/x86_64-linux/lib/libcudnn.so.8
/usr/local/cuda-11.7/targets/x86_64-linux/lib/libcudnn_adv_infer.so.8
/usr/local/cuda-11.7/targets/x86_64-linux/lib/libcudnn_adv_train.so.8
/usr/local/cuda-11.7/targets/x86_64-linux/lib/libcudnn_cnn_infer.so.8
/usr/local/cuda-11.7/targets/x86_64-linux/lib/libcudnn_cnn_train.so.8
/usr/local/cuda-11.7/targets/x86_64-linux/lib/libcudnn_ops_infer.so.8
/usr/local/cuda-11.7/targets/x86_64-linux/lib/libcudnn_ops_train.so.8
HIP runtime version: N/A
MIOpen runtime version: N/A
Is XNNPACK available: True

CPU:
Architecture:        x86_64
CPU op-mode(s):      32-bit, 64-bit
Byte Order:          Little Endian
CPU(s):              16
On-line CPU(s) list: 0-15
Thread(s) per core:  2
Core(s) per socket:  8
Socket(s):           1
NUMA node(s):        1
Vendor ID:           GenuineIntel
CPU family:          6
Model:               158
Model name:          Intel(R) Core(TM) i9-9980HK CPU @ 2.40GHz
Stepping:            13
CPU MHz:             1672.804
CPU max MHz:         5000.0000
CPU min MHz:         800.0000
BogoMIPS:            4800.00
Virtualisation:      VT-x
L1d cache:           32K
L1i cache:           32K
L2 cache:            256K
L3 cache:            16384K
NUMA node0 CPU(s):   0-15
Flags:               fpu vme de pse tsc msr pae mce cx8 apic sep mtrr pge mca cmov pat pse36 clflush dts acpi mmx fxsr sse sse2 ss ht tm pbe syscall nx pdpe1gb rdtscp lm constant_tsc art arch_perfmon pebs bts rep_good nopl xtopology nonstop_tsc cpuid aperfmperf pni pclmulqdq dtes64 monitor ds_cpl vmx est tm2 ssse3 sdbg fma cx16 xtpr pdcm pcid sse4_1 sse4_2 x2apic movbe popcnt tsc_deadline_timer aes xsave avx f16c rdrand lahf_lm abm 3dnowprefetch cpuid_fault epb invpcid_single ssbd ibrs ibpb stibp ibrs_enhanced tpr_shadow vnmi flexpriority ept vpid ept_ad fsgsbase tsc_adjust bmi1 avx2 smep bmi2 erms invpcid mpx rdseed adx smap clflushopt intel_pt xsaveopt xsavec xgetbv1 xsaves dtherm ida arat pln pts hwp hwp_notify hwp_act_window hwp_epp md_clear flush_l1d arch_capabilities

Versions of relevant libraries:
[pip3] numpy==1.24.3
[pip3] torch==2.0.0
[pip3] torchvision==0.15.1
[pip3] triton==2.0.0
[conda] numpy                     1.24.3                   pypi_0    pypi
[conda] torch                     2.0.0                    pypi_0    pypi
[conda] torchvision               0.15.1                   pypi_0    pypi
[conda] triton                    2.0.0                    pypi_0    pypi
cc @ezyang @gchanan @zou3519 @robieta @chaekit @aaronenyeshi @ngimel @nbcsm @guotuofeng @guyang3532 @gaoteng-git @tiffzhaofb @dzhulgakov @davidberard98
The text was updated successfully, but these errors were encountered: