[RFC] Integrate autograd profiler with torch.distributed.rpc #39675
Assignees

Labels
module: rpc
Related to RPC, distributed autograd, RRef, and distributed optimizer
oncall: profiler
profiler-related issues (cpu, gpu, kineto)
triaged
This issue has been looked at a team member, and triaged and prioritized into an appropriate module
Comments
rohan-varma
added a commit
that referenced
this issue
Jun 9, 2020
RFC: #39675 This diff contains the message scaffolding and profiler changes in order to be able to remotely run the profiler across different nodes and aggregate the results on a single node. As discussed, we have implemented this by creating new message types, that similar to autograd messages, wrap the profiling information with the original message, and send this new message over the wire. On the receiving end, this wrapped message is detected, we fetch the original message from it, and process the original message with the profiler enabled. When sending a response with profiling information, we serialize the profiled `Events` and send them back over RPC. When such a message is received, the events profiled on the remote node are stored (added back to the local profiler). Changes in this PR: - New message types (run_with_profiling_req, run_with_profiling_resp) to send profiling info over the wire. Message parsing logic is added to handle these wrapped types. - Handling of sending profiler data over the wire, in particular, the attributes of the `ProfilerConfig` and the serialized profiled `Event`s - The logic for wrapping RPC messages is deduped with that in `rpc_with_autograd`, and the common payload wrapping/unwrapping logic is moved to helper functions in `rpc/utils.cpp` - Changes in `autograd/utils.cpp` to detect if we have enabled the profiler and are sending an RPC, if so, uses the above new message types - Changes in request_callback to parse and turn on the profiler in a thread-local fashion - Serialization and deserialization of profiling `Events`, and support to add the remote events to the thread-local profiler - Introduction of the concept of `node_id`, which as discussed with @ilia-cher , will be used along with the `Event`s handle attribute to distinguish between events. When there are events from different nodes, this node information is rendered in the profile output (e.g. when printing tables), otherwise, it is not, since it is irrelevant. - Some changes to profiler.cpp to add useful helper methods/guards - toHere() is now profiled for RRefs - Unittests ### Example use case ``` # Assume that RPC is initialized across worker_1 and worker_2 # On worker_1 with torch.autograd.profiler.profile(profile_memory=True) as p: rpc.rpc_sync(worker_2, torch.add, args=(torch.tensor(1), torch.tensor(1)) print(p.key_averages().table()) # should show that torch.add ran on remote node, in addition to the local profiling output p.export_chrome_trace("/tmp/dist_trace.json") # should show torch.add in trace, and indicate that it ran on a remote node ``` ### Example outputs The printed table will look like: ``` --------------- --------------- --------------- --------------- --------------- --------------- Name Self CPU total % Self CPU total CPU total % CPU total CPU time avg Number of Calls Node ID ---------------------------------------------------- --------------- --------------- --------------- --------------- --------------- --------------- --------------- rpc_async#udf_with_torch_ops(worker1 -> worker2) 0.00% 0.000us 0 4.549ms 4.549ms 1 1 ones 8.31% 29.587us 20.72% 73.806us 36.903us 2 2 empty 16.42% 58.487us 16.42% 58.487us 9.748us 6 2 fill_ 5.77% 20.557us 6.78% 24.136us 12.068us 2 2 is_complex 1.00% 3.579us 1.00% 3.579us 1.789us 2 2 add 18.33% 65.315us 22.42% 79.883us 79.883us 1 2 mul 13.40% 47.737us 15.98% 56.943us 56.943us 1 2 relu 7.34% 26.154us 15.34% 54.637us 54.637us 1 2 threshold 5.77% 20.561us 8.00% 28.483us 28.483us 1 2 sigmoid 11.06% 39.392us 25.54% 90.965us 90.965us 1 2 sigmoid_out 10.46% 37.260us 12.59% 44.865us 44.865us 1 2 resize_ 2.13% 7.605us 2.13% 7.605us 7.605us 1 2 ---------------------------------------------------- --------------- --------------- --------------- --------------- --------------- --------------- --------------- ``` The trace would look like: 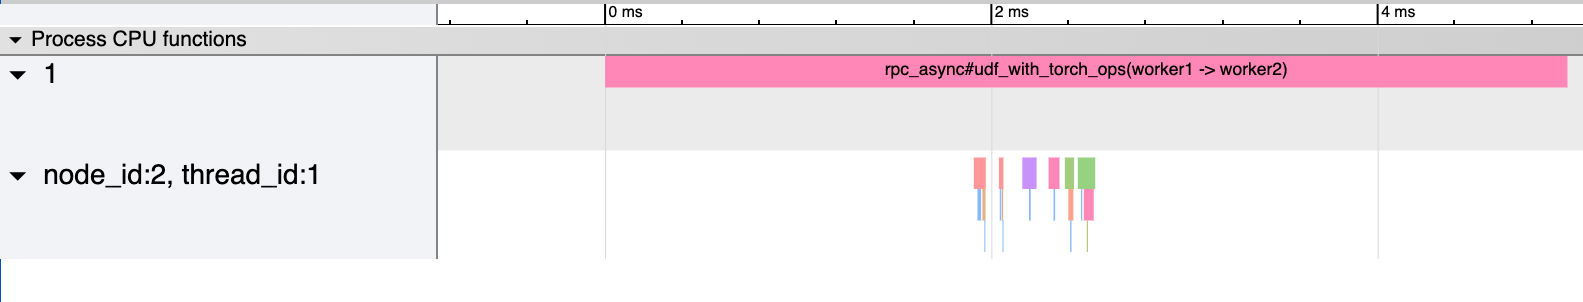 (Note that the events on Node 2 are offset by an approximate time that is described below). Differential Revision: [D19510010](https://our.internmc.facebook.com/intern/diff/D19510010/) **NOTE FOR REVIEWERS**: This PR has internal Facebook specific changes or comments, please review them on [Phabricator](https://our.internmc.facebook.com/intern/diff/D19510010/)! [ghstack-poisoned]
rohan-varma
added a commit
that referenced
this issue
Jun 10, 2020
RFC: #39675 This diff contains the message scaffolding and profiler changes in order to be able to remotely run the profiler across different nodes and aggregate the results on a single node. As discussed, we have implemented this by creating new message types, that similar to autograd messages, wrap the profiling information with the original message, and send this new message over the wire. On the receiving end, this wrapped message is detected, we fetch the original message from it, and process the original message with the profiler enabled. When sending a response with profiling information, we serialize the profiled `Events` and send them back over RPC. When such a message is received, the events profiled on the remote node are stored (added back to the local profiler). Changes in this PR: - New message types (run_with_profiling_req, run_with_profiling_resp) to send profiling info over the wire. Message parsing logic is added to handle these wrapped types. - Handling of sending profiler data over the wire, in particular, the attributes of the `ProfilerConfig` and the serialized profiled `Event`s - The logic for wrapping RPC messages is deduped with that in `rpc_with_autograd`, and the common payload wrapping/unwrapping logic is moved to helper functions in `rpc/utils.cpp` - Changes in `autograd/utils.cpp` to detect if we have enabled the profiler and are sending an RPC, if so, uses the above new message types - Changes in request_callback to parse and turn on the profiler in a thread-local fashion - Serialization and deserialization of profiling `Events`, and support to add the remote events to the thread-local profiler - Introduction of the concept of `node_id`, which as discussed with @ilia-cher , will be used along with the `Event`s handle attribute to distinguish between events. When there are events from different nodes, this node information is rendered in the profile output (e.g. when printing tables), otherwise, it is not, since it is irrelevant. - Some changes to profiler.cpp to add useful helper methods/guards - toHere() is now profiled for RRefs - Unittests ### Example use case ``` # Assume that RPC is initialized across worker_1 and worker_2 # On worker_1 with torch.autograd.profiler.profile(profile_memory=True) as p: rpc.rpc_sync(worker_2, torch.add, args=(torch.tensor(1), torch.tensor(1)) print(p.key_averages().table()) # should show that torch.add ran on remote node, in addition to the local profiling output p.export_chrome_trace("/tmp/dist_trace.json") # should show torch.add in trace, and indicate that it ran on a remote node ``` ### Example outputs The printed table will look like: ``` --------------- --------------- --------------- --------------- --------------- --------------- Name Self CPU total % Self CPU total CPU total % CPU total CPU time avg Number of Calls Node ID ---------------------------------------------------- --------------- --------------- --------------- --------------- --------------- --------------- --------------- rpc_async#udf_with_torch_ops(worker1 -> worker2) 0.00% 0.000us 0 4.549ms 4.549ms 1 1 ones 8.31% 29.587us 20.72% 73.806us 36.903us 2 2 empty 16.42% 58.487us 16.42% 58.487us 9.748us 6 2 fill_ 5.77% 20.557us 6.78% 24.136us 12.068us 2 2 is_complex 1.00% 3.579us 1.00% 3.579us 1.789us 2 2 add 18.33% 65.315us 22.42% 79.883us 79.883us 1 2 mul 13.40% 47.737us 15.98% 56.943us 56.943us 1 2 relu 7.34% 26.154us 15.34% 54.637us 54.637us 1 2 threshold 5.77% 20.561us 8.00% 28.483us 28.483us 1 2 sigmoid 11.06% 39.392us 25.54% 90.965us 90.965us 1 2 sigmoid_out 10.46% 37.260us 12.59% 44.865us 44.865us 1 2 resize_ 2.13% 7.605us 2.13% 7.605us 7.605us 1 2 ---------------------------------------------------- --------------- --------------- --------------- --------------- --------------- --------------- --------------- ``` The trace would look like:  (Note that the events on Node 2 are offset by an approximate time that is described below). Differential Revision: [D19510010](https://our.internmc.facebook.com/intern/diff/D19510010/) **NOTE FOR REVIEWERS**: This PR has internal Facebook specific changes or comments, please review them on [Phabricator](https://our.internmc.facebook.com/intern/diff/D19510010/)! [ghstack-poisoned]
rohan-varma
added a commit
that referenced
this issue
Jun 11, 2020
RFC: #39675 This diff contains the message scaffolding and profiler changes in order to be able to remotely run the profiler across different nodes and aggregate the results on a single node. As discussed, we have implemented this by creating new message types, that similar to autograd messages, wrap the profiling information with the original message, and send this new message over the wire. On the receiving end, this wrapped message is detected, we fetch the original message from it, and process the original message with the profiler enabled. When sending a response with profiling information, we serialize the profiled `Events` and send them back over RPC. When such a message is received, the events profiled on the remote node are stored (added back to the local profiler). Changes in this PR: - New message types (run_with_profiling_req, run_with_profiling_resp) to send profiling info over the wire. Message parsing logic is added to handle these wrapped types. - Handling of sending profiler data over the wire, in particular, the attributes of the `ProfilerConfig` and the serialized profiled `Event`s - The logic for wrapping RPC messages is deduped with that in `rpc_with_autograd`, and the common payload wrapping/unwrapping logic is moved to helper functions in `rpc/utils.cpp` - Changes in `autograd/utils.cpp` to detect if we have enabled the profiler and are sending an RPC, if so, uses the above new message types - Changes in request_callback to parse and turn on the profiler in a thread-local fashion - Serialization and deserialization of profiling `Events`, and support to add the remote events to the thread-local profiler - Introduction of the concept of `node_id`, which as discussed with @ilia-cher , will be used along with the `Event`s handle attribute to distinguish between events. When there are events from different nodes, this node information is rendered in the profile output (e.g. when printing tables), otherwise, it is not, since it is irrelevant. - Some changes to profiler.cpp to add useful helper methods/guards - toHere() is now profiled for RRefs - Unittests ### Example use case ``` # Assume that RPC is initialized across worker_1 and worker_2 # On worker_1 with torch.autograd.profiler.profile(profile_memory=True) as p: rpc.rpc_sync(worker_2, torch.add, args=(torch.tensor(1), torch.tensor(1)) print(p.key_averages().table()) # should show that torch.add ran on remote node, in addition to the local profiling output p.export_chrome_trace("/tmp/dist_trace.json") # should show torch.add in trace, and indicate that it ran on a remote node ``` ### Example outputs The printed table will look like: ``` --------------- --------------- --------------- --------------- --------------- --------------- Name Self CPU total % Self CPU total CPU total % CPU total CPU time avg Number of Calls Node ID ---------------------------------------------------- --------------- --------------- --------------- --------------- --------------- --------------- --------------- rpc_async#udf_with_torch_ops(worker1 -> worker2) 0.00% 0.000us 0 4.549ms 4.549ms 1 1 ones 8.31% 29.587us 20.72% 73.806us 36.903us 2 2 empty 16.42% 58.487us 16.42% 58.487us 9.748us 6 2 fill_ 5.77% 20.557us 6.78% 24.136us 12.068us 2 2 is_complex 1.00% 3.579us 1.00% 3.579us 1.789us 2 2 add 18.33% 65.315us 22.42% 79.883us 79.883us 1 2 mul 13.40% 47.737us 15.98% 56.943us 56.943us 1 2 relu 7.34% 26.154us 15.34% 54.637us 54.637us 1 2 threshold 5.77% 20.561us 8.00% 28.483us 28.483us 1 2 sigmoid 11.06% 39.392us 25.54% 90.965us 90.965us 1 2 sigmoid_out 10.46% 37.260us 12.59% 44.865us 44.865us 1 2 resize_ 2.13% 7.605us 2.13% 7.605us 7.605us 1 2 ---------------------------------------------------- --------------- --------------- --------------- --------------- --------------- --------------- --------------- ``` The trace would look like:  (Note that the events on Node 2 are offset by an approximate time that is described below). Differential Revision: [D19510010](https://our.internmc.facebook.com/intern/diff/D19510010/) **NOTE FOR REVIEWERS**: This PR has internal Facebook specific changes or comments, please review them on [Phabricator](https://our.internmc.facebook.com/intern/diff/D19510010/)! [ghstack-poisoned]
rohan-varma
added a commit
that referenced
this issue
Jun 12, 2020
RFC: #39675 This diff contains the message scaffolding and profiler changes in order to be able to remotely run the profiler across different nodes and aggregate the results on a single node. As discussed, we have implemented this by creating new message types, that similar to autograd messages, wrap the profiling information with the original message, and send this new message over the wire. On the receiving end, this wrapped message is detected, we fetch the original message from it, and process the original message with the profiler enabled. When sending a response with profiling information, we serialize the profiled `Events` and send them back over RPC. When such a message is received, the events profiled on the remote node are stored (added back to the local profiler). Changes in this PR: - New message types (run_with_profiling_req, run_with_profiling_resp) to send profiling info over the wire. Message parsing logic is added to handle these wrapped types. - Handling of sending profiler data over the wire, in particular, the attributes of the `ProfilerConfig` and the serialized profiled `Event`s - The logic for wrapping RPC messages is deduped with that in `rpc_with_autograd`, and the common payload wrapping/unwrapping logic is moved to helper functions in `rpc/utils.cpp` - Changes in `autograd/utils.cpp` to detect if we have enabled the profiler and are sending an RPC, if so, uses the above new message types - Changes in request_callback to parse and turn on the profiler in a thread-local fashion - Serialization and deserialization of profiling `Events`, and support to add the remote events to the thread-local profiler - Introduction of the concept of `node_id`, which as discussed with @ilia-cher , will be used along with the `Event`s handle attribute to distinguish between events. When there are events from different nodes, this node information is rendered in the profile output (e.g. when printing tables), otherwise, it is not, since it is irrelevant. - Some changes to profiler.cpp to add useful helper methods/guards - toHere() is now profiled for RRefs - Unittests ### Example use case ``` # Assume that RPC is initialized across worker_1 and worker_2 # On worker_1 with torch.autograd.profiler.profile(profile_memory=True) as p: rpc.rpc_sync(worker_2, torch.add, args=(torch.tensor(1), torch.tensor(1)) print(p.key_averages().table()) # should show that torch.add ran on remote node, in addition to the local profiling output p.export_chrome_trace("/tmp/dist_trace.json") # should show torch.add in trace, and indicate that it ran on a remote node ``` ### Example outputs The printed table will look like: ``` --------------- --------------- --------------- --------------- --------------- --------------- Name Self CPU total % Self CPU total CPU total % CPU total CPU time avg Number of Calls Node ID ---------------------------------------------------- --------------- --------------- --------------- --------------- --------------- --------------- --------------- rpc_async#udf_with_torch_ops(worker1 -> worker2) 0.00% 0.000us 0 4.549ms 4.549ms 1 1 ones 8.31% 29.587us 20.72% 73.806us 36.903us 2 2 empty 16.42% 58.487us 16.42% 58.487us 9.748us 6 2 fill_ 5.77% 20.557us 6.78% 24.136us 12.068us 2 2 is_complex 1.00% 3.579us 1.00% 3.579us 1.789us 2 2 add 18.33% 65.315us 22.42% 79.883us 79.883us 1 2 mul 13.40% 47.737us 15.98% 56.943us 56.943us 1 2 relu 7.34% 26.154us 15.34% 54.637us 54.637us 1 2 threshold 5.77% 20.561us 8.00% 28.483us 28.483us 1 2 sigmoid 11.06% 39.392us 25.54% 90.965us 90.965us 1 2 sigmoid_out 10.46% 37.260us 12.59% 44.865us 44.865us 1 2 resize_ 2.13% 7.605us 2.13% 7.605us 7.605us 1 2 ---------------------------------------------------- --------------- --------------- --------------- --------------- --------------- --------------- --------------- ``` The trace would look like:  (Note that the events on Node 2 are offset by an approximate time that is described below). Differential Revision: [D19510010](https://our.internmc.facebook.com/intern/diff/D19510010/) **NOTE FOR REVIEWERS**: This PR has internal Facebook specific changes or comments, please review them on [Phabricator](https://our.internmc.facebook.com/intern/diff/D19510010/)! [ghstack-poisoned]
rohan-varma
added a commit
that referenced
this issue
Jun 13, 2020
RFC: #39675 This diff contains the message scaffolding and profiler changes in order to be able to remotely run the profiler across different nodes and aggregate the results on a single node. As discussed, we have implemented this by creating new message types, that similar to autograd messages, wrap the profiling information with the original message, and send this new message over the wire. On the receiving end, this wrapped message is detected, we fetch the original message from it, and process the original message with the profiler enabled. When sending a response with profiling information, we serialize the profiled `Events` and send them back over RPC. When such a message is received, the events profiled on the remote node are stored (added back to the local profiler). Changes in this PR: - New message types (run_with_profiling_req, run_with_profiling_resp) to send profiling info over the wire. Message parsing logic is added to handle these wrapped types. - Handling of sending profiler data over the wire, in particular, the attributes of the `ProfilerConfig` and the serialized profiled `Event`s - The logic for wrapping RPC messages is deduped with that in `rpc_with_autograd`, and the common payload wrapping/unwrapping logic is moved to helper functions in `rpc/utils.cpp` - Changes in `autograd/utils.cpp` to detect if we have enabled the profiler and are sending an RPC, if so, uses the above new message types - Changes in request_callback to parse and turn on the profiler in a thread-local fashion - Serialization and deserialization of profiling `Events`, and support to add the remote events to the thread-local profiler - Introduction of the concept of `node_id`, which as discussed with @ilia-cher , will be used along with the `Event`s handle attribute to distinguish between events. When there are events from different nodes, this node information is rendered in the profile output (e.g. when printing tables), otherwise, it is not, since it is irrelevant. - Some changes to profiler.cpp to add useful helper methods/guards - toHere() is now profiled for RRefs - Unittests ### Example use case ``` # Assume that RPC is initialized across worker_1 and worker_2 # On worker_1 with torch.autograd.profiler.profile(profile_memory=True) as p: rpc.rpc_sync(worker_2, torch.add, args=(torch.tensor(1), torch.tensor(1)) print(p.key_averages().table()) # should show that torch.add ran on remote node, in addition to the local profiling output p.export_chrome_trace("/tmp/dist_trace.json") # should show torch.add in trace, and indicate that it ran on a remote node ``` ### Example outputs The printed table will look like: ``` --------------- --------------- --------------- --------------- --------------- --------------- Name Self CPU total % Self CPU total CPU total % CPU total CPU time avg Number of Calls Node ID ---------------------------------------------------- --------------- --------------- --------------- --------------- --------------- --------------- --------------- rpc_async#udf_with_torch_ops(worker1 -> worker2) 0.00% 0.000us 0 4.549ms 4.549ms 1 1 ones 8.31% 29.587us 20.72% 73.806us 36.903us 2 2 empty 16.42% 58.487us 16.42% 58.487us 9.748us 6 2 fill_ 5.77% 20.557us 6.78% 24.136us 12.068us 2 2 is_complex 1.00% 3.579us 1.00% 3.579us 1.789us 2 2 add 18.33% 65.315us 22.42% 79.883us 79.883us 1 2 mul 13.40% 47.737us 15.98% 56.943us 56.943us 1 2 relu 7.34% 26.154us 15.34% 54.637us 54.637us 1 2 threshold 5.77% 20.561us 8.00% 28.483us 28.483us 1 2 sigmoid 11.06% 39.392us 25.54% 90.965us 90.965us 1 2 sigmoid_out 10.46% 37.260us 12.59% 44.865us 44.865us 1 2 resize_ 2.13% 7.605us 2.13% 7.605us 7.605us 1 2 ---------------------------------------------------- --------------- --------------- --------------- --------------- --------------- --------------- --------------- ``` The trace would look like:  (Note that the events on Node 2 are offset by an approximate time that is described below). Differential Revision: [D19510010](https://our.internmc.facebook.com/intern/diff/D19510010/) **NOTE FOR REVIEWERS**: This PR has internal Facebook specific changes or comments, please review them on [Phabricator](https://our.internmc.facebook.com/intern/diff/D19510010/)! [ghstack-poisoned]
rohan-varma
added a commit
that referenced
this issue
Jun 16, 2020
RFC: #39675 This diff contains the message scaffolding and profiler changes in order to be able to remotely run the profiler across different nodes and aggregate the results on a single node. As discussed, we have implemented this by creating new message types, that similar to autograd messages, wrap the profiling information with the original message, and send this new message over the wire. On the receiving end, this wrapped message is detected, we fetch the original message from it, and process the original message with the profiler enabled. When sending a response with profiling information, we serialize the profiled `Events` and send them back over RPC. When such a message is received, the events profiled on the remote node are stored (added back to the local profiler). Changes in this PR: - New message types (run_with_profiling_req, run_with_profiling_resp) to send profiling info over the wire. Message parsing logic is added to handle these wrapped types. - Handling of sending profiler data over the wire, in particular, the attributes of the `ProfilerConfig` and the serialized profiled `Event`s - The logic for wrapping RPC messages is deduped with that in `rpc_with_autograd`, and the common payload wrapping/unwrapping logic is moved to helper functions in `rpc/utils.cpp` - Changes in `autograd/utils.cpp` to detect if we have enabled the profiler and are sending an RPC, if so, uses the above new message types - Changes in request_callback to parse and turn on the profiler in a thread-local fashion - Serialization and deserialization of profiling `Events`, and support to add the remote events to the thread-local profiler - Introduction of the concept of `node_id`, which as discussed with @ilia-cher , will be used along with the `Event`s handle attribute to distinguish between events. When there are events from different nodes, this node information is rendered in the profile output (e.g. when printing tables), otherwise, it is not, since it is irrelevant. - Some changes to profiler.cpp to add useful helper methods/guards - toHere() is now profiled for RRefs - Unittests ### Example use case ``` # Assume that RPC is initialized across worker_1 and worker_2 # On worker_1 with torch.autograd.profiler.profile(profile_memory=True) as p: rpc.rpc_sync(worker_2, torch.add, args=(torch.tensor(1), torch.tensor(1)) print(p.key_averages().table()) # should show that torch.add ran on remote node, in addition to the local profiling output p.export_chrome_trace("/tmp/dist_trace.json") # should show torch.add in trace, and indicate that it ran on a remote node ``` ### Example outputs The printed table will look like: ``` --------------- --------------- --------------- --------------- --------------- --------------- Name Self CPU total % Self CPU total CPU total % CPU total CPU time avg Number of Calls Node ID ---------------------------------------------------- --------------- --------------- --------------- --------------- --------------- --------------- --------------- rpc_async#udf_with_torch_ops(worker1 -> worker2) 0.00% 0.000us 0 4.549ms 4.549ms 1 1 ones 8.31% 29.587us 20.72% 73.806us 36.903us 2 2 empty 16.42% 58.487us 16.42% 58.487us 9.748us 6 2 fill_ 5.77% 20.557us 6.78% 24.136us 12.068us 2 2 is_complex 1.00% 3.579us 1.00% 3.579us 1.789us 2 2 add 18.33% 65.315us 22.42% 79.883us 79.883us 1 2 mul 13.40% 47.737us 15.98% 56.943us 56.943us 1 2 relu 7.34% 26.154us 15.34% 54.637us 54.637us 1 2 threshold 5.77% 20.561us 8.00% 28.483us 28.483us 1 2 sigmoid 11.06% 39.392us 25.54% 90.965us 90.965us 1 2 sigmoid_out 10.46% 37.260us 12.59% 44.865us 44.865us 1 2 resize_ 2.13% 7.605us 2.13% 7.605us 7.605us 1 2 ---------------------------------------------------- --------------- --------------- --------------- --------------- --------------- --------------- --------------- ``` The trace would look like:  (Note that the events on Node 2 are offset by an approximate time that is described below). Result of `test_stress_light_rpc` before and after this diff: ``` > Rank 2 finished testing 1000 times in 0.3938124179840088 seconds. > Rank 0 finished testing 1000 times in 0.37873053550720215 seconds. > Rank 3 finished testing 1000 times in 0.3726627826690674 seconds. > Rank 1 finished testing 1000 times in 0.38887619972229004 seconds. ``` After ``` Rank 1 finished testing 1000 times in 0.3706204891204834 seconds. Rank 2 finished testing 1000 times in 0.37796807289123535 seconds. Rank 3 finished testing 1000 times in 0.39801454544067383 seconds. Rank 0 finished testing 1000 times in 0.40166211128234863 seconds. ``` Differential Revision: [D19510010](https://our.internmc.facebook.com/intern/diff/D19510010/) **NOTE FOR REVIEWERS**: This PR has internal Facebook specific changes or comments, please review them on [Phabricator](https://our.internmc.facebook.com/intern/diff/D19510010/)! [ghstack-poisoned]
rohan-varma
added a commit
that referenced
this issue
Jun 18, 2020
RFC: #39675 This diff contains the message scaffolding and profiler changes in order to be able to remotely run the profiler across different nodes and aggregate the results on a single node. As discussed, we have implemented this by creating new message types, that similar to autograd messages, wrap the profiling information with the original message, and send this new message over the wire. On the receiving end, this wrapped message is detected, we fetch the original message from it, and process the original message with the profiler enabled. When sending a response with profiling information, we serialize the profiled `Events` and send them back over RPC. When such a message is received, the events profiled on the remote node are stored (added back to the local profiler). Changes in this PR: - New message types (run_with_profiling_req, run_with_profiling_resp) to send profiling info over the wire. Message parsing logic is added to handle these wrapped types. - Handling of sending profiler data over the wire, in particular, the attributes of the `ProfilerConfig` and the serialized profiled `Event`s - The logic for wrapping RPC messages is deduped with that in `rpc_with_autograd`, and the common payload wrapping/unwrapping logic is moved to helper functions in `rpc/utils.cpp` - Changes in `autograd/utils.cpp` to detect if we have enabled the profiler and are sending an RPC, if so, uses the above new message types - Changes in request_callback to parse and turn on the profiler in a thread-local fashion - Serialization and deserialization of profiling `Events`, and support to add the remote events to the thread-local profiler - Introduction of the concept of `node_id`, which as discussed with @ilia-cher , will be used along with the `Event`s handle attribute to distinguish between events. When there are events from different nodes, this node information is rendered in the profile output (e.g. when printing tables), otherwise, it is not, since it is irrelevant. - Some changes to profiler.cpp to add useful helper methods/guards - toHere() is now profiled for RRefs - Unittests ### Example use case ``` # Assume that RPC is initialized across worker_1 and worker_2 # On worker_1 with torch.autograd.profiler.profile(profile_memory=True) as p: rpc.rpc_sync(worker_2, torch.add, args=(torch.tensor(1), torch.tensor(1)) print(p.key_averages().table()) # should show that torch.add ran on remote node, in addition to the local profiling output p.export_chrome_trace("/tmp/dist_trace.json") # should show torch.add in trace, and indicate that it ran on a remote node ``` ### Example outputs The printed table will look like: ``` --------------- --------------- --------------- --------------- --------------- --------------- Name Self CPU total % Self CPU total CPU total % CPU total CPU time avg Number of Calls Node ID ---------------------------------------------------- --------------- --------------- --------------- --------------- --------------- --------------- --------------- rpc_async#udf_with_torch_ops(worker1 -> worker2) 0.00% 0.000us 0 4.549ms 4.549ms 1 1 ones 8.31% 29.587us 20.72% 73.806us 36.903us 2 2 empty 16.42% 58.487us 16.42% 58.487us 9.748us 6 2 fill_ 5.77% 20.557us 6.78% 24.136us 12.068us 2 2 is_complex 1.00% 3.579us 1.00% 3.579us 1.789us 2 2 add 18.33% 65.315us 22.42% 79.883us 79.883us 1 2 mul 13.40% 47.737us 15.98% 56.943us 56.943us 1 2 relu 7.34% 26.154us 15.34% 54.637us 54.637us 1 2 threshold 5.77% 20.561us 8.00% 28.483us 28.483us 1 2 sigmoid 11.06% 39.392us 25.54% 90.965us 90.965us 1 2 sigmoid_out 10.46% 37.260us 12.59% 44.865us 44.865us 1 2 resize_ 2.13% 7.605us 2.13% 7.605us 7.605us 1 2 ---------------------------------------------------- --------------- --------------- --------------- --------------- --------------- --------------- --------------- ``` The trace would look like:  (Note that the events on Node 2 are offset by an approximate time that is described below). Result of `test_stress_light_rpc` before and after this diff: ``` > Rank 2 finished testing 1000 times in 0.3938124179840088 seconds. > Rank 0 finished testing 1000 times in 0.37873053550720215 seconds. > Rank 3 finished testing 1000 times in 0.3726627826690674 seconds. > Rank 1 finished testing 1000 times in 0.38887619972229004 seconds. ``` After ``` Rank 1 finished testing 1000 times in 0.3706204891204834 seconds. Rank 2 finished testing 1000 times in 0.37796807289123535 seconds. Rank 3 finished testing 1000 times in 0.39801454544067383 seconds. Rank 0 finished testing 1000 times in 0.40166211128234863 seconds. ``` Differential Revision: [D19510010](https://our.internmc.facebook.com/intern/diff/D19510010/) **NOTE FOR REVIEWERS**: This PR has internal Facebook specific changes or comments, please review them on [Phabricator](https://our.internmc.facebook.com/intern/diff/D19510010/)! [ghstack-poisoned]
|
done in #38748 |
Sign up for free
to join this conversation on GitHub.
Already have an account?
Sign in to comment
🚀 Feature
The profiler is a useful tool to gain insight regarding the operations run inside a model, and is a commonly used tool to diagnose performance issues and optimize models. This RFC seeks to describe how the profiler will be integrated with
torch.distributed.rpc, so RPC-based training jobs can benefit from the profiler. In particular, the main motivation is to be able to remotely collect the profile for operations run under RPC across different nodes.Example use case
The printed table will look like:
The trace would look like:

(Note that the events on Node 2 are offset by an approximate time that is described below).
Design and Implementation
Similar to how autograd information is propagated in RPC, we will wrap internal RPC messages with profiling information when RPCs are invoked under the profiler context. This wrapping/unwrapping of messages will be done transparently for the user, and the user will not have to change their code/use of the profiler at all. The flow is as follows:
torch::autograd::profiler::profilerEnabled()).record_functionAPI provided by the profiler. We also attach callbacks to the future corresponding to the RPC, so that callbacks corresponding to the profiler can be run at the appropriate time.ProfilerConfigthat the profiler on the original node was invoked with.ProfilerConfigcontains data such as whether the profiler was enabled, whether we should profile memory, record cuda, etc.torch::autograd::profiler::Events corresponding to the operations that were profiled. After building the response message, we wrap it into a message that contains the profiling response. For example, this profiling response will contain metadata about the profiling as well as the profiled events. We send this result back to the caller over the wire.ProfilerThreadLocalState] (https://github.com/pytorch/pytorch/blob/a5e023f28ab3b0d7f39d6ab9487e409a6db94eb7/torch/csrc/autograd/profiler.cpp).__start_profileEvent on the remote node. For traces, we will also offset the remote trace by an estimated delta, which is currently computed as the difference in__start_profileevents on the local and remote node, which aims to approximate the amount of time from when the profiler was enabled locally and remotely (note that this does not account for possible clock skew issues).cc @pietern @mrshenli @pritamdamania87 @zhaojuanmao @satgera @gqchen @aazzolini @rohan-varma @xush6528 @jjlilley @osalpekar
The text was updated successfully, but these errors were encountered: