View the byte values of a file as a line graph in DOS.
Ever thought how a file looks like when seen as a graph (other than a audio file)? This is how. Totally random? Or is there a pattern?

Enter Filename whose graph is to be viewed.
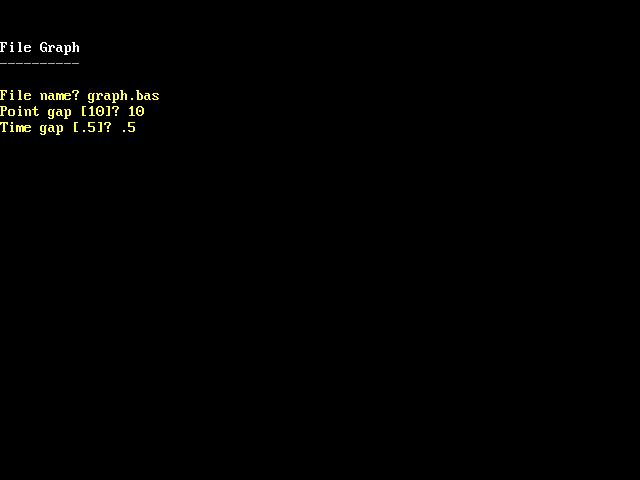
Point gap is the distance between 2 points (bytes).
Time gap is the delay between drawing of 2 points.
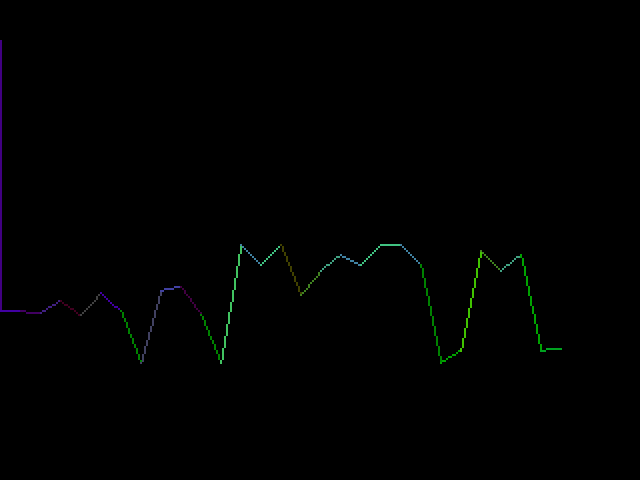
graph.bas's amplitude graph can be seen.
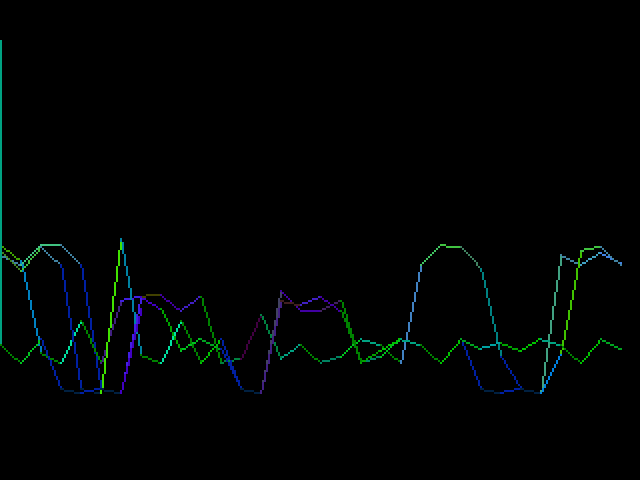
Multiple traces are dran one after another.
Press Enter to clear old traces.